Tlingit-Haida vs Immigrants from Western Europe Disability
COMPARE
Tlingit-Haida
Immigrants from Western Europe
Disability
Disability Comparison
Tlingit-Haida
Immigrants from Western Europe
13.5%
DISABILITY
0.0/ 100
METRIC RATING
309th/ 347
METRIC RANK
12.0%
DISABILITY
10.1/ 100
METRIC RATING
205th/ 347
METRIC RANK
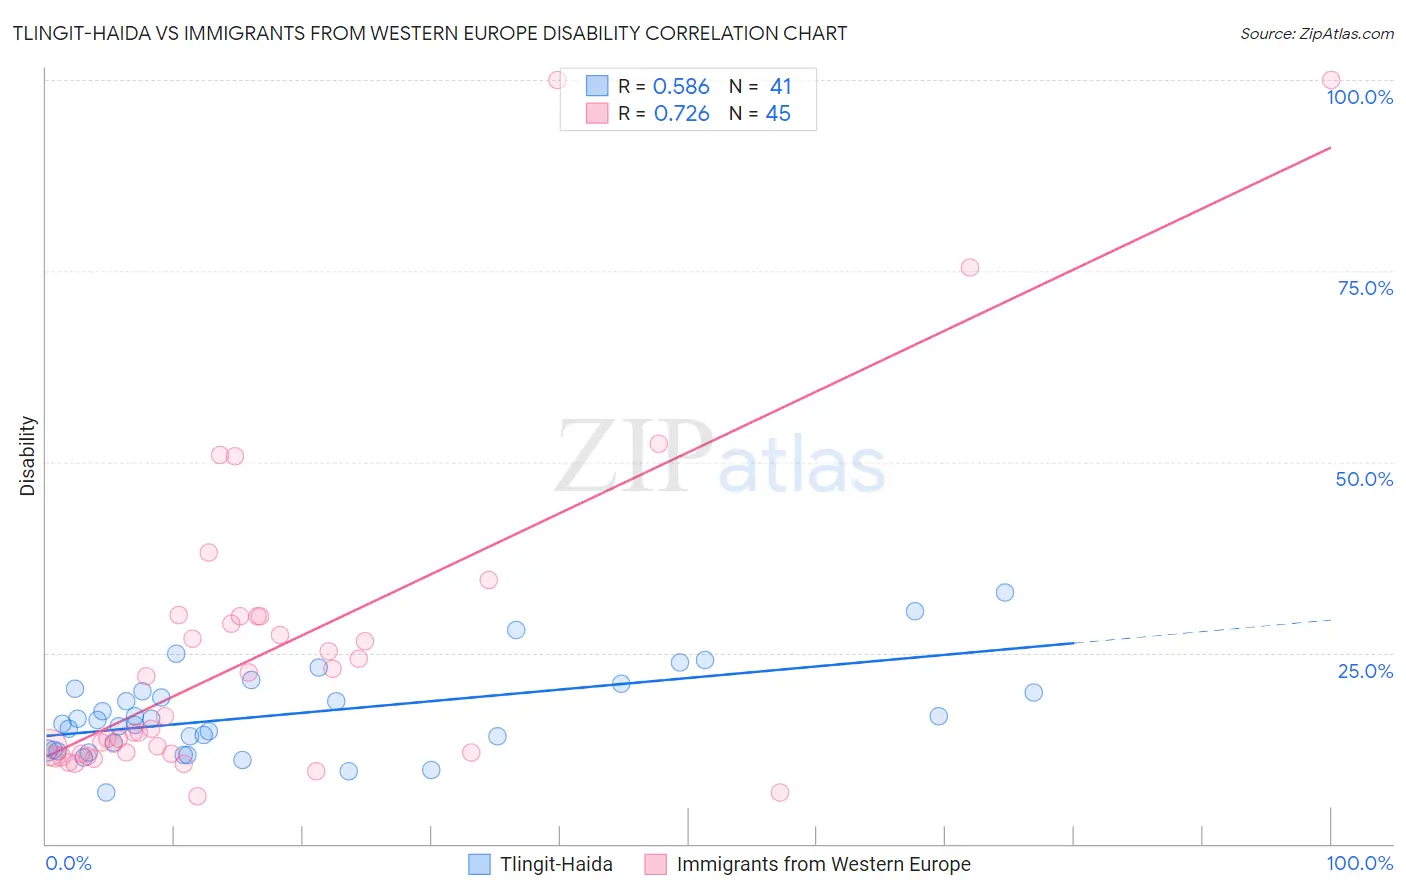
Tlingit-Haida vs Immigrants from Western Europe Disability Correlation Chart
The statistical analysis conducted on geographies consisting of 60,854,514 people shows a substantial positive correlation between the proportion of Tlingit-Haida and percentage of population with a disability in the United States with a correlation coefficient (R) of 0.586 and weighted average of 13.5%. Similarly, the statistical analysis conducted on geographies consisting of 494,041,803 people shows a strong positive correlation between the proportion of Immigrants from Western Europe and percentage of population with a disability in the United States with a correlation coefficient (R) of 0.726 and weighted average of 12.0%, a difference of 13.0%.
Disability Correlation Summary
| Measurement | Tlingit-Haida | Immigrants from Western Europe |
| Minimum | 6.7% | 6.3% |
| Maximum | 32.8% | 100.0% |
| Range | 26.1% | 93.7% |
| Mean | 17.0% | 25.2% |
| Median | 16.3% | 15.0% |
| Interquartile 25% (IQ1) | 12.2% | 11.7% |
| Interquartile 75% (IQ3) | 20.2% | 29.8% |
| Interquartile Range (IQR) | 8.0% | 18.0% |
| Standard Deviation (Sample) | 5.7% | 21.6% |
| Standard Deviation (Population) | 5.7% | 21.3% |
Similar Demographics by Disability
Demographics Similar to Tlingit-Haida by Disability
In terms of disability, the demographic groups most similar to Tlingit-Haida are French American Indian (13.5%, a difference of 0.080%), Shoshone (13.5%, a difference of 0.18%), Cape Verdean (13.5%, a difference of 0.23%), Blackfeet (13.6%, a difference of 0.53%), and Delaware (13.6%, a difference of 0.56%).
| Demographics | Rating | Rank | Disability |
| Arapaho | 0.0 /100 | #302 | Tragic 13.2% |
| Scotch-Irish | 0.0 /100 | #303 | Tragic 13.3% |
| Yakama | 0.0 /100 | #304 | Tragic 13.4% |
| French Canadians | 0.0 /100 | #305 | Tragic 13.4% |
| Cape Verdeans | 0.0 /100 | #306 | Tragic 13.5% |
| Shoshone | 0.0 /100 | #307 | Tragic 13.5% |
| French American Indians | 0.0 /100 | #308 | Tragic 13.5% |
| Tlingit-Haida | 0.0 /100 | #309 | Tragic 13.5% |
| Blackfeet | 0.0 /100 | #310 | Tragic 13.6% |
| Delaware | 0.0 /100 | #311 | Tragic 13.6% |
| Spanish Americans | 0.0 /100 | #312 | Tragic 13.6% |
| Cree | 0.0 /100 | #313 | Tragic 13.7% |
| Blacks/African Americans | 0.0 /100 | #314 | Tragic 13.7% |
| Puget Sound Salish | 0.0 /100 | #315 | Tragic 13.7% |
| Pima | 0.0 /100 | #316 | Tragic 13.7% |
Demographics Similar to Immigrants from Western Europe by Disability
In terms of disability, the demographic groups most similar to Immigrants from Western Europe are Immigrants from Senegal (12.0%, a difference of 0.080%), Immigrants from Thailand (12.0%, a difference of 0.10%), Immigrants from Caribbean (12.0%, a difference of 0.12%), British West Indian (12.0%, a difference of 0.16%), and Mexican American Indian (12.0%, a difference of 0.16%).
| Demographics | Rating | Rank | Disability |
| Ukrainians | 14.7 /100 | #198 | Poor 11.9% |
| Immigrants | Panama | 14.6 /100 | #199 | Poor 11.9% |
| Belizeans | 12.8 /100 | #200 | Poor 11.9% |
| Assyrians/Chaldeans/Syriacs | 12.6 /100 | #201 | Poor 11.9% |
| Immigrants | England | 12.0 /100 | #202 | Poor 12.0% |
| British West Indians | 11.5 /100 | #203 | Poor 12.0% |
| Mexican American Indians | 11.4 /100 | #204 | Poor 12.0% |
| Immigrants | Western Europe | 10.1 /100 | #205 | Poor 12.0% |
| Immigrants | Senegal | 9.4 /100 | #206 | Tragic 12.0% |
| Immigrants | Thailand | 9.3 /100 | #207 | Tragic 12.0% |
| Immigrants | Caribbean | 9.1 /100 | #208 | Tragic 12.0% |
| Danes | 8.7 /100 | #209 | Tragic 12.0% |
| Czechs | 7.9 /100 | #210 | Tragic 12.0% |
| Immigrants | Cambodia | 7.3 /100 | #211 | Tragic 12.0% |
| Austrians | 7.2 /100 | #212 | Tragic 12.0% |