Tlingit-Haida vs White/Caucasian Child Poverty Under the Age of 16
COMPARE
Tlingit-Haida
White/Caucasian
Child Poverty Under the Age of 16
Child Poverty Under the Age of 16 Comparison
Tlingit-Haida
Whites/Caucasians
14.9%
CHILD POVERTY UNDER THE AGE OF 16
94.1/ 100
METRIC RATING
109th/ 347
METRIC RANK
16.2%
CHILD POVERTY UNDER THE AGE OF 16
50.0/ 100
METRIC RATING
174th/ 347
METRIC RANK
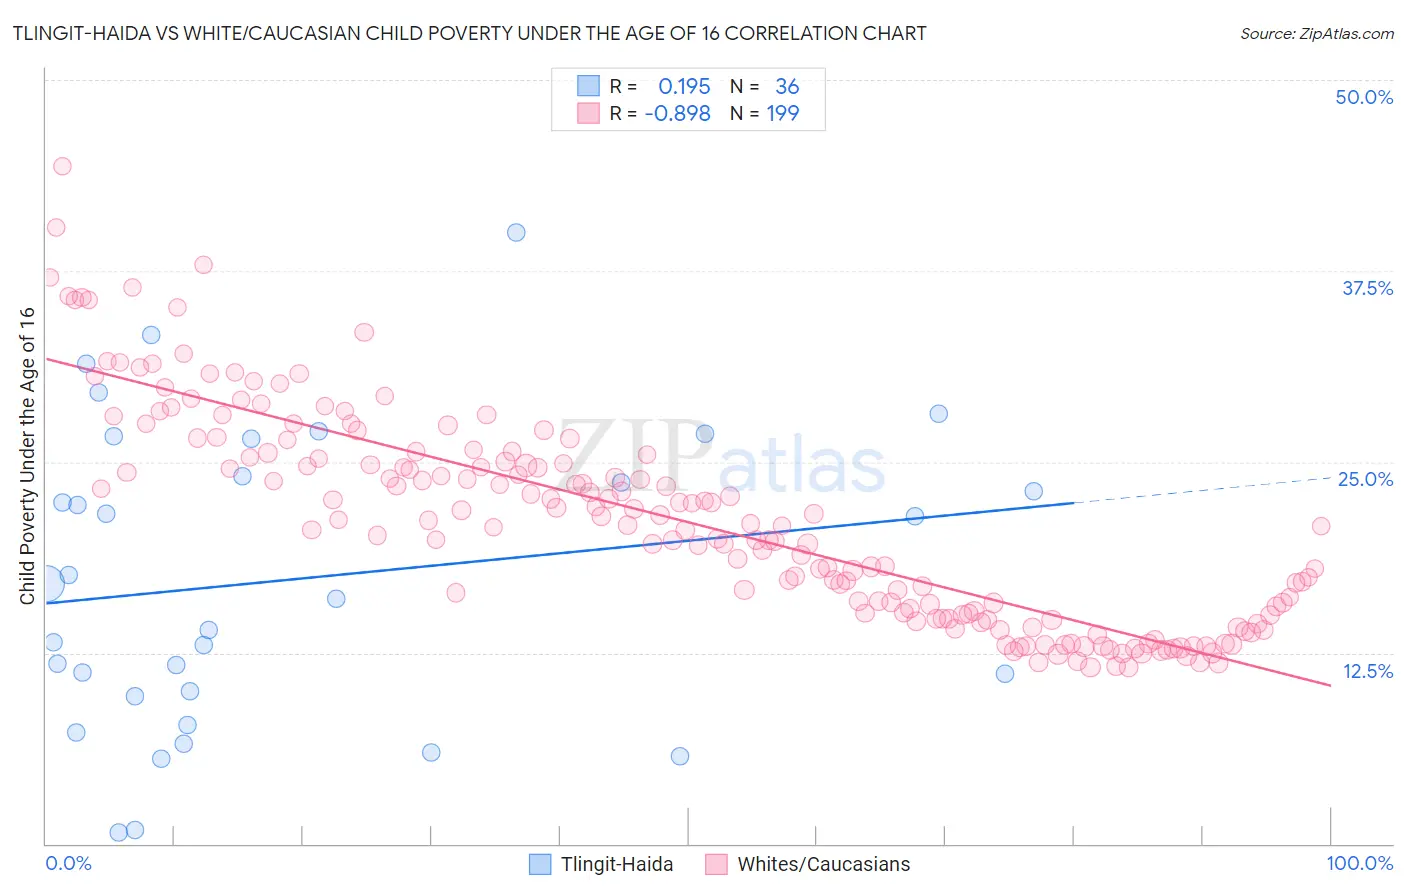
Tlingit-Haida vs White/Caucasian Child Poverty Under the Age of 16 Correlation Chart
The statistical analysis conducted on geographies consisting of 60,748,719 people shows a poor positive correlation between the proportion of Tlingit-Haida and poverty level among children under the age of 16 in the United States with a correlation coefficient (R) of 0.195 and weighted average of 14.9%. Similarly, the statistical analysis conducted on geographies consisting of 568,969,283 people shows a very strong negative correlation between the proportion of Whites/Caucasians and poverty level among children under the age of 16 in the United States with a correlation coefficient (R) of -0.898 and weighted average of 16.2%, a difference of 9.0%.
Child Poverty Under the Age of 16 Correlation Summary
| Measurement | Tlingit-Haida | White/Caucasian |
| Minimum | 0.72% | 11.5% |
| Maximum | 40.0% | 44.4% |
| Range | 39.3% | 32.8% |
| Mean | 17.4% | 21.1% |
| Median | 16.5% | 20.8% |
| Interquartile 25% (IQ1) | 9.8% | 15.0% |
| Interquartile 75% (IQ3) | 25.3% | 25.3% |
| Interquartile Range (IQR) | 15.5% | 10.4% |
| Standard Deviation (Sample) | 9.8% | 6.9% |
| Standard Deviation (Population) | 9.6% | 6.8% |
Similar Demographics by Child Poverty Under the Age of 16
Demographics Similar to Tlingit-Haida by Child Poverty Under the Age of 16
In terms of child poverty under the age of 16, the demographic groups most similar to Tlingit-Haida are Jordanian (14.8%, a difference of 0.070%), Chilean (14.8%, a difference of 0.16%), Serbian (14.8%, a difference of 0.22%), English (14.9%, a difference of 0.34%), and Basque (14.8%, a difference of 0.35%).
| Demographics | Rating | Rank | Child Poverty Under the Age of 16 |
| Romanians | 95.0 /100 | #102 | Exceptional 14.8% |
| Immigrants | Egypt | 94.9 /100 | #103 | Exceptional 14.8% |
| Immigrants | England | 94.8 /100 | #104 | Exceptional 14.8% |
| Basques | 94.7 /100 | #105 | Exceptional 14.8% |
| Serbians | 94.5 /100 | #106 | Exceptional 14.8% |
| Chileans | 94.4 /100 | #107 | Exceptional 14.8% |
| Jordanians | 94.2 /100 | #108 | Exceptional 14.8% |
| Tlingit-Haida | 94.1 /100 | #109 | Exceptional 14.9% |
| English | 93.5 /100 | #110 | Exceptional 14.9% |
| Immigrants | Denmark | 93.5 /100 | #111 | Exceptional 14.9% |
| Irish | 93.4 /100 | #112 | Exceptional 14.9% |
| Belgians | 93.3 /100 | #113 | Exceptional 14.9% |
| Sri Lankans | 93.2 /100 | #114 | Exceptional 14.9% |
| Immigrants | Ukraine | 93.1 /100 | #115 | Exceptional 14.9% |
| Carpatho Rusyns | 93.1 /100 | #116 | Exceptional 14.9% |
Demographics Similar to Whites/Caucasians by Child Poverty Under the Age of 16
In terms of child poverty under the age of 16, the demographic groups most similar to Whites/Caucasians are Immigrants from Saudi Arabia (16.2%, a difference of 0.25%), Afghan (16.2%, a difference of 0.27%), Hungarian (16.2%, a difference of 0.30%), Scotch-Irish (16.3%, a difference of 0.34%), and Lebanese (16.3%, a difference of 0.50%).
| Demographics | Rating | Rank | Child Poverty Under the Age of 16 |
| Costa Ricans | 61.1 /100 | #167 | Good 16.0% |
| South Americans | 57.9 /100 | #168 | Average 16.0% |
| Uruguayans | 54.7 /100 | #169 | Average 16.1% |
| Immigrants | Colombia | 54.4 /100 | #170 | Average 16.1% |
| Hungarians | 52.5 /100 | #171 | Average 16.2% |
| Afghans | 52.3 /100 | #172 | Average 16.2% |
| Immigrants | Saudi Arabia | 52.1 /100 | #173 | Average 16.2% |
| Whites/Caucasians | 50.0 /100 | #174 | Average 16.2% |
| Scotch-Irish | 47.1 /100 | #175 | Average 16.3% |
| Lebanese | 45.9 /100 | #176 | Average 16.3% |
| Ethiopians | 43.4 /100 | #177 | Average 16.3% |
| Immigrants | Ethiopia | 42.3 /100 | #178 | Average 16.4% |
| Immigrants | Syria | 42.3 /100 | #179 | Average 16.4% |
| South American Indians | 41.8 /100 | #180 | Average 16.4% |
| Immigrants | South America | 40.8 /100 | #181 | Average 16.4% |