Immigrants from Thailand vs Spanish American Disability Age 65 to 74
COMPARE
Immigrants from Thailand
Spanish American
Disability Age 65 to 74
Disability Age 65 to 74 Comparison
Immigrants from Thailand
Spanish Americans
24.3%
DISABILITY AGE 65 TO 74
5.2/ 100
METRIC RATING
231st/ 347
METRIC RANK
25.9%
DISABILITY AGE 65 TO 74
0.0/ 100
METRIC RATING
283rd/ 347
METRIC RANK
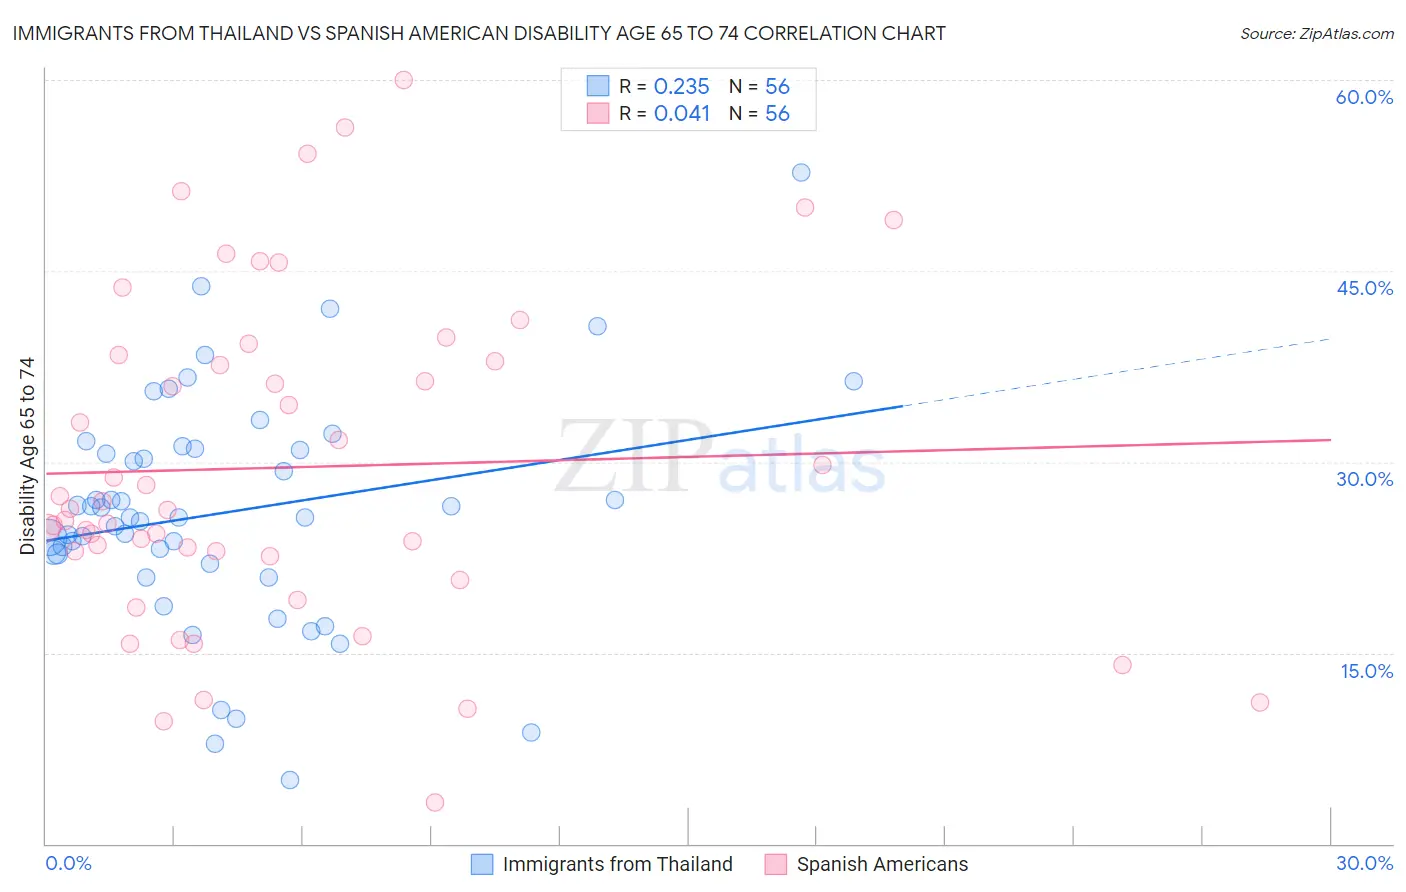
Immigrants from Thailand vs Spanish American Disability Age 65 to 74 Correlation Chart
The statistical analysis conducted on geographies consisting of 316,664,344 people shows a weak positive correlation between the proportion of Immigrants from Thailand and percentage of population with a disability between the ages 65 and 75 in the United States with a correlation coefficient (R) of 0.235 and weighted average of 24.3%. Similarly, the statistical analysis conducted on geographies consisting of 103,158,709 people shows no correlation between the proportion of Spanish Americans and percentage of population with a disability between the ages 65 and 75 in the United States with a correlation coefficient (R) of 0.041 and weighted average of 25.9%, a difference of 6.7%.
Disability Age 65 to 74 Correlation Summary
| Measurement | Immigrants from Thailand | Spanish American |
| Minimum | 5.0% | 3.2% |
| Maximum | 52.8% | 60.0% |
| Range | 47.8% | 56.8% |
| Mean | 26.0% | 29.6% |
| Median | 25.7% | 26.3% |
| Interquartile 25% (IQ1) | 22.4% | 22.8% |
| Interquartile 75% (IQ3) | 31.0% | 38.1% |
| Interquartile Range (IQR) | 8.6% | 15.3% |
| Standard Deviation (Sample) | 9.1% | 12.9% |
| Standard Deviation (Population) | 9.0% | 12.8% |
Similar Demographics by Disability Age 65 to 74
Demographics Similar to Immigrants from Thailand by Disability Age 65 to 74
In terms of disability age 65 to 74, the demographic groups most similar to Immigrants from Thailand are Immigrants from Zaire (24.3%, a difference of 0.050%), Barbadian (24.3%, a difference of 0.20%), Bahamian (24.4%, a difference of 0.21%), Celtic (24.2%, a difference of 0.31%), and Panamanian (24.4%, a difference of 0.32%).
| Demographics | Rating | Rank | Disability Age 65 to 74 |
| Immigrants | Panama | 8.6 /100 | #224 | Tragic 24.1% |
| Bermudans | 8.2 /100 | #225 | Tragic 24.2% |
| Iraqis | 8.1 /100 | #226 | Tragic 24.2% |
| Nigerians | 7.8 /100 | #227 | Tragic 24.2% |
| Whites/Caucasians | 6.6 /100 | #228 | Tragic 24.2% |
| Celtics | 6.4 /100 | #229 | Tragic 24.2% |
| Barbadians | 6.0 /100 | #230 | Tragic 24.3% |
| Immigrants | Thailand | 5.2 /100 | #231 | Tragic 24.3% |
| Immigrants | Zaire | 5.0 /100 | #232 | Tragic 24.3% |
| Bahamians | 4.5 /100 | #233 | Tragic 24.4% |
| Panamanians | 4.2 /100 | #234 | Tragic 24.4% |
| Scotch-Irish | 3.8 /100 | #235 | Tragic 24.4% |
| German Russians | 3.7 /100 | #236 | Tragic 24.4% |
| West Indians | 3.4 /100 | #237 | Tragic 24.5% |
| Immigrants | Ghana | 3.0 /100 | #238 | Tragic 24.5% |
Demographics Similar to Spanish Americans by Disability Age 65 to 74
In terms of disability age 65 to 74, the demographic groups most similar to Spanish Americans are Delaware (25.9%, a difference of 0.14%), Immigrants from the Azores (26.0%, a difference of 0.19%), Immigrants from Honduras (25.9%, a difference of 0.21%), Immigrants from Congo (26.0%, a difference of 0.21%), and Cree (25.9%, a difference of 0.24%).
| Demographics | Rating | Rank | Disability Age 65 to 74 |
| French American Indians | 0.1 /100 | #276 | Tragic 25.8% |
| Belizeans | 0.1 /100 | #277 | Tragic 25.8% |
| Immigrants | Belize | 0.1 /100 | #278 | Tragic 25.8% |
| U.S. Virgin Islanders | 0.1 /100 | #279 | Tragic 25.9% |
| Cree | 0.1 /100 | #280 | Tragic 25.9% |
| Immigrants | Honduras | 0.1 /100 | #281 | Tragic 25.9% |
| Delaware | 0.1 /100 | #282 | Tragic 25.9% |
| Spanish Americans | 0.0 /100 | #283 | Tragic 25.9% |
| Immigrants | Azores | 0.0 /100 | #284 | Tragic 26.0% |
| Immigrants | Congo | 0.0 /100 | #285 | Tragic 26.0% |
| Immigrants | Micronesia | 0.0 /100 | #286 | Tragic 26.1% |
| Immigrants | Laos | 0.0 /100 | #287 | Tragic 26.1% |
| Mexican American Indians | 0.0 /100 | #288 | Tragic 26.2% |
| Africans | 0.0 /100 | #289 | Tragic 26.2% |
| Immigrants | Cabo Verde | 0.0 /100 | #290 | Tragic 26.3% |