Ugandan vs Spanish American Disability Age 65 to 74
COMPARE
Ugandan
Spanish American
Disability Age 65 to 74
Disability Age 65 to 74 Comparison
Ugandans
Spanish Americans
22.7%
DISABILITY AGE 65 TO 74
85.4/ 100
METRIC RATING
140th/ 347
METRIC RANK
25.9%
DISABILITY AGE 65 TO 74
0.0/ 100
METRIC RATING
283rd/ 347
METRIC RANK
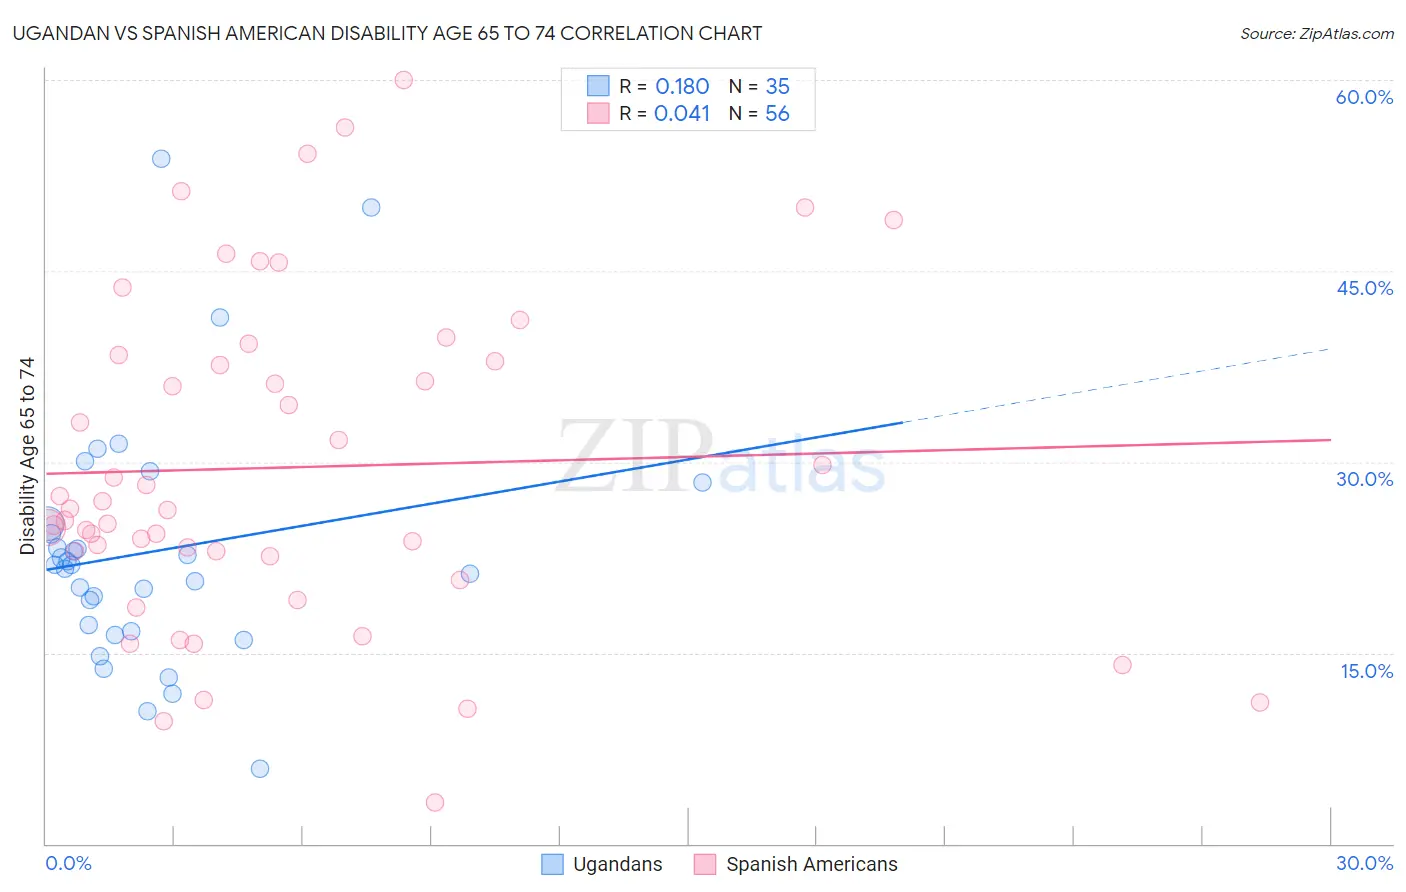
Ugandan vs Spanish American Disability Age 65 to 74 Correlation Chart
The statistical analysis conducted on geographies consisting of 93,935,891 people shows a poor positive correlation between the proportion of Ugandans and percentage of population with a disability between the ages 65 and 75 in the United States with a correlation coefficient (R) of 0.180 and weighted average of 22.7%. Similarly, the statistical analysis conducted on geographies consisting of 103,158,709 people shows no correlation between the proportion of Spanish Americans and percentage of population with a disability between the ages 65 and 75 in the United States with a correlation coefficient (R) of 0.041 and weighted average of 25.9%, a difference of 14.1%.
Disability Age 65 to 74 Correlation Summary
| Measurement | Ugandan | Spanish American |
| Minimum | 5.9% | 3.2% |
| Maximum | 53.8% | 60.0% |
| Range | 48.0% | 56.8% |
| Mean | 23.0% | 29.6% |
| Median | 21.9% | 26.3% |
| Interquartile 25% (IQ1) | 16.7% | 22.8% |
| Interquartile 75% (IQ3) | 25.1% | 38.1% |
| Interquartile Range (IQR) | 8.4% | 15.3% |
| Standard Deviation (Sample) | 9.9% | 12.9% |
| Standard Deviation (Population) | 9.8% | 12.8% |
Similar Demographics by Disability Age 65 to 74
Demographics Similar to Ugandans by Disability Age 65 to 74
In terms of disability age 65 to 74, the demographic groups most similar to Ugandans are Belgian (22.7%, a difference of 0.010%), Immigrants from Ethiopia (22.7%, a difference of 0.020%), Immigrants from Syria (22.7%, a difference of 0.040%), Arab (22.8%, a difference of 0.080%), and Danish (22.8%, a difference of 0.12%).
| Demographics | Rating | Rank | Disability Age 65 to 74 |
| Northern Europeans | 88.9 /100 | #133 | Excellent 22.6% |
| Afghans | 88.6 /100 | #134 | Excellent 22.6% |
| Immigrants | Ukraine | 88.4 /100 | #135 | Excellent 22.6% |
| Ethiopians | 87.9 /100 | #136 | Excellent 22.7% |
| Taiwanese | 87.6 /100 | #137 | Excellent 22.7% |
| Immigrants | Moldova | 87.3 /100 | #138 | Excellent 22.7% |
| Immigrants | Syria | 85.8 /100 | #139 | Excellent 22.7% |
| Ugandans | 85.4 /100 | #140 | Excellent 22.7% |
| Belgians | 85.3 /100 | #141 | Excellent 22.7% |
| Immigrants | Ethiopia | 85.3 /100 | #142 | Excellent 22.7% |
| Arabs | 84.8 /100 | #143 | Excellent 22.8% |
| Danes | 84.4 /100 | #144 | Excellent 22.8% |
| Immigrants | Uganda | 84.0 /100 | #145 | Excellent 22.8% |
| Alsatians | 83.7 /100 | #146 | Excellent 22.8% |
| Immigrants | Uzbekistan | 83.1 /100 | #147 | Excellent 22.8% |
Demographics Similar to Spanish Americans by Disability Age 65 to 74
In terms of disability age 65 to 74, the demographic groups most similar to Spanish Americans are Delaware (25.9%, a difference of 0.14%), Immigrants from the Azores (26.0%, a difference of 0.19%), Immigrants from Honduras (25.9%, a difference of 0.21%), Immigrants from Congo (26.0%, a difference of 0.21%), and Cree (25.9%, a difference of 0.24%).
| Demographics | Rating | Rank | Disability Age 65 to 74 |
| French American Indians | 0.1 /100 | #276 | Tragic 25.8% |
| Belizeans | 0.1 /100 | #277 | Tragic 25.8% |
| Immigrants | Belize | 0.1 /100 | #278 | Tragic 25.8% |
| U.S. Virgin Islanders | 0.1 /100 | #279 | Tragic 25.9% |
| Cree | 0.1 /100 | #280 | Tragic 25.9% |
| Immigrants | Honduras | 0.1 /100 | #281 | Tragic 25.9% |
| Delaware | 0.1 /100 | #282 | Tragic 25.9% |
| Spanish Americans | 0.0 /100 | #283 | Tragic 25.9% |
| Immigrants | Azores | 0.0 /100 | #284 | Tragic 26.0% |
| Immigrants | Congo | 0.0 /100 | #285 | Tragic 26.0% |
| Immigrants | Micronesia | 0.0 /100 | #286 | Tragic 26.1% |
| Immigrants | Laos | 0.0 /100 | #287 | Tragic 26.1% |
| Mexican American Indians | 0.0 /100 | #288 | Tragic 26.2% |
| Africans | 0.0 /100 | #289 | Tragic 26.2% |
| Immigrants | Cabo Verde | 0.0 /100 | #290 | Tragic 26.3% |