Tlingit-Haida vs Spanish American Single Mother Households
COMPARE
Tlingit-Haida
Spanish American
Single Mother Households
Single Mother Households Comparison
Tlingit-Haida
Spanish Americans
5.7%
SINGLE MOTHER HOUSEHOLDS
96.4/ 100
METRIC RATING
97th/ 347
METRIC RANK
7.0%
SINGLE MOTHER HOUSEHOLDS
1.6/ 100
METRIC RATING
231st/ 347
METRIC RANK
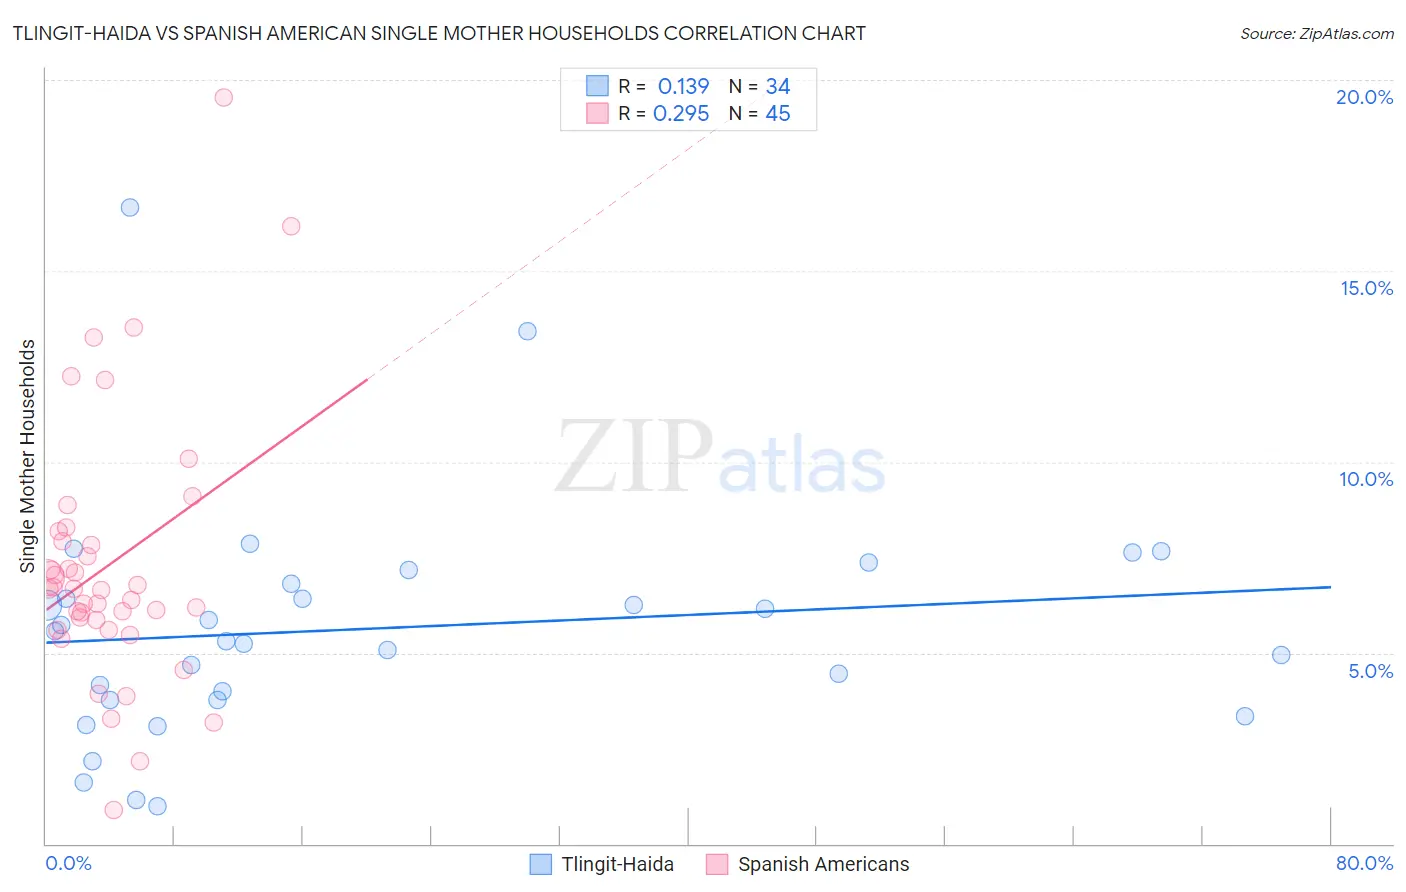
Tlingit-Haida vs Spanish American Single Mother Households Correlation Chart
The statistical analysis conducted on geographies consisting of 60,822,631 people shows a poor positive correlation between the proportion of Tlingit-Haida and percentage of single mother households in the United States with a correlation coefficient (R) of 0.139 and weighted average of 5.7%. Similarly, the statistical analysis conducted on geographies consisting of 103,117,345 people shows a weak positive correlation between the proportion of Spanish Americans and percentage of single mother households in the United States with a correlation coefficient (R) of 0.295 and weighted average of 7.0%, a difference of 22.3%.
Single Mother Households Correlation Summary
| Measurement | Tlingit-Haida | Spanish American |
| Minimum | 0.98% | 0.87% |
| Maximum | 16.7% | 19.5% |
| Range | 15.7% | 18.7% |
| Mean | 5.6% | 7.3% |
| Median | 5.4% | 6.7% |
| Interquartile 25% (IQ1) | 3.8% | 5.7% |
| Interquartile 75% (IQ3) | 6.8% | 8.0% |
| Interquartile Range (IQR) | 3.0% | 2.3% |
| Standard Deviation (Sample) | 3.1% | 3.5% |
| Standard Deviation (Population) | 3.0% | 3.4% |
Similar Demographics by Single Mother Households
Demographics Similar to Tlingit-Haida by Single Mother Households
In terms of single mother households, the demographic groups most similar to Tlingit-Haida are Immigrants from South Africa (5.7%, a difference of 0.040%), Austrian (5.7%, a difference of 0.050%), Immigrants from Poland (5.8%, a difference of 0.10%), Scandinavian (5.8%, a difference of 0.11%), and German (5.8%, a difference of 0.14%).
| Demographics | Rating | Rank | Single Mother Households |
| Immigrants | Indonesia | 97.2 /100 | #90 | Exceptional 5.7% |
| Europeans | 97.0 /100 | #91 | Exceptional 5.7% |
| Immigrants | Western Asia | 96.7 /100 | #92 | Exceptional 5.7% |
| Serbians | 96.7 /100 | #93 | Exceptional 5.7% |
| Basques | 96.7 /100 | #94 | Exceptional 5.7% |
| Slovaks | 96.6 /100 | #95 | Exceptional 5.7% |
| Austrians | 96.4 /100 | #96 | Exceptional 5.7% |
| Tlingit-Haida | 96.4 /100 | #97 | Exceptional 5.7% |
| Immigrants | South Africa | 96.3 /100 | #98 | Exceptional 5.7% |
| Immigrants | Poland | 96.3 /100 | #99 | Exceptional 5.8% |
| Scandinavians | 96.2 /100 | #100 | Exceptional 5.8% |
| Germans | 96.2 /100 | #101 | Exceptional 5.8% |
| English | 96.2 /100 | #102 | Exceptional 5.8% |
| Scottish | 96.2 /100 | #103 | Exceptional 5.8% |
| Northern Europeans | 96.2 /100 | #104 | Exceptional 5.8% |
Demographics Similar to Spanish Americans by Single Mother Households
In terms of single mother households, the demographic groups most similar to Spanish Americans are Creek (7.0%, a difference of 0.020%), Comanche (7.0%, a difference of 0.060%), Choctaw (7.0%, a difference of 0.23%), Chickasaw (7.0%, a difference of 0.25%), and Immigrants from Burma/Myanmar (7.0%, a difference of 0.32%).
| Demographics | Rating | Rank | Single Mother Households |
| Immigrants | Sudan | 3.5 /100 | #224 | Tragic 6.9% |
| Sudanese | 3.1 /100 | #225 | Tragic 6.9% |
| Paiute | 2.4 /100 | #226 | Tragic 7.0% |
| Kenyans | 2.3 /100 | #227 | Tragic 7.0% |
| Iroquois | 2.2 /100 | #228 | Tragic 7.0% |
| Immigrants | Kenya | 2.1 /100 | #229 | Tragic 7.0% |
| Creek | 1.6 /100 | #230 | Tragic 7.0% |
| Spanish Americans | 1.6 /100 | #231 | Tragic 7.0% |
| Comanche | 1.5 /100 | #232 | Tragic 7.0% |
| Choctaw | 1.4 /100 | #233 | Tragic 7.0% |
| Chickasaw | 1.4 /100 | #234 | Tragic 7.0% |
| Immigrants | Burma/Myanmar | 1.4 /100 | #235 | Tragic 7.0% |
| Ute | 1.0 /100 | #236 | Tragic 7.1% |
| Arapaho | 1.0 /100 | #237 | Tragic 7.1% |
| Panamanians | 0.9 /100 | #238 | Tragic 7.1% |