Tlingit-Haida vs Spanish American Unemployment Among Ages 30 to 34 years
COMPARE
Tlingit-Haida
Spanish American
Unemployment Among Ages 30 to 34 years
Unemployment Among Ages 30 to 34 years Comparison
Tlingit-Haida
Spanish Americans
6.0%
UNEMPLOYMENT AMONG AGES 30 TO 34 YEARS
0.2/ 100
METRIC RATING
251st/ 347
METRIC RANK
6.2%
UNEMPLOYMENT AMONG AGES 30 TO 34 YEARS
0.0/ 100
METRIC RATING
263rd/ 347
METRIC RANK
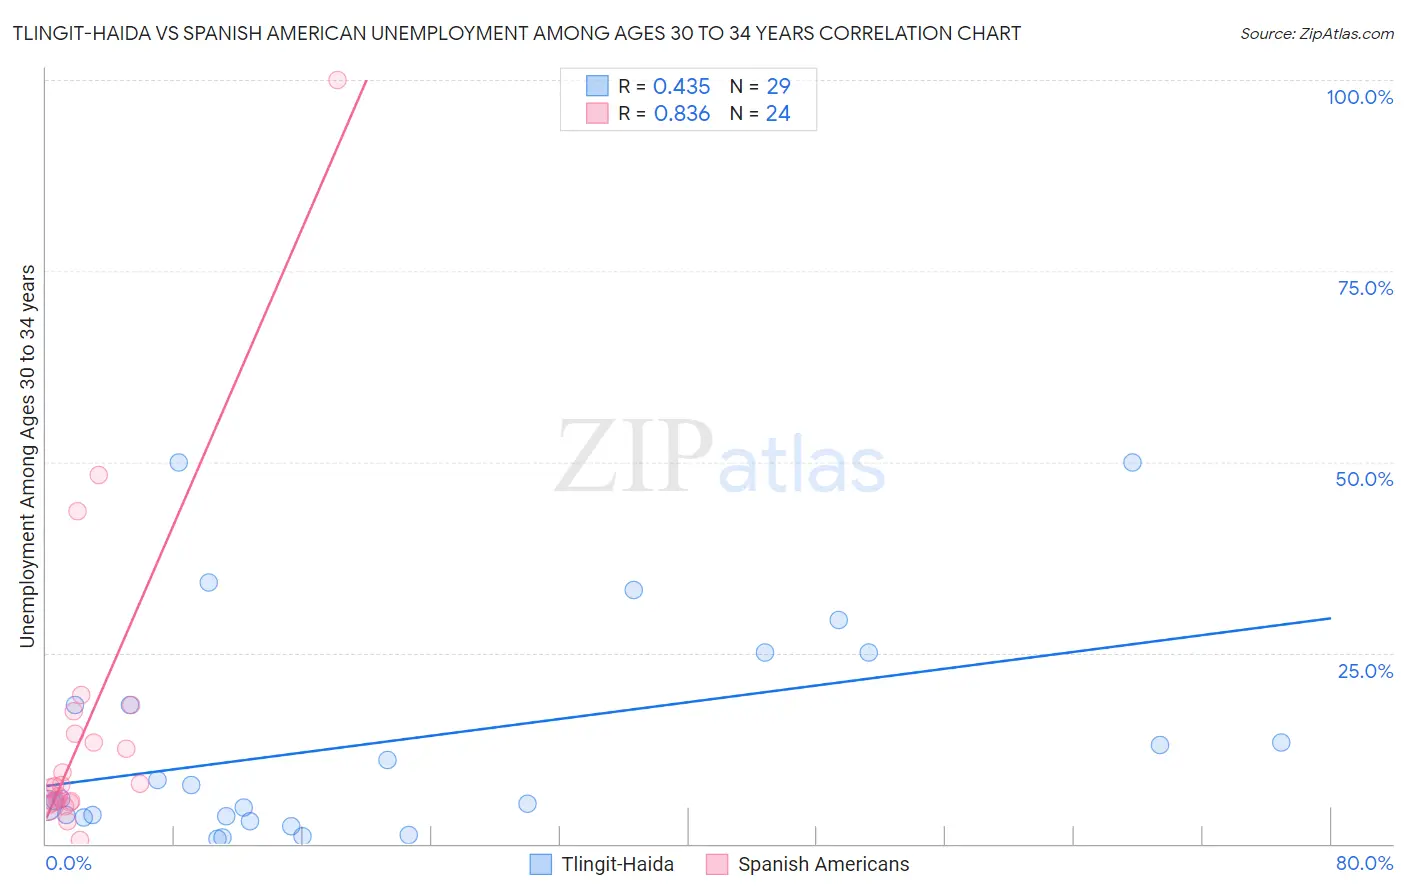
Tlingit-Haida vs Spanish American Unemployment Among Ages 30 to 34 years Correlation Chart
The statistical analysis conducted on geographies consisting of 59,624,165 people shows a moderate positive correlation between the proportion of Tlingit-Haida and unemployment rate among population between the ages 30 and 34 in the United States with a correlation coefficient (R) of 0.435 and weighted average of 6.0%. Similarly, the statistical analysis conducted on geographies consisting of 101,538,285 people shows a very strong positive correlation between the proportion of Spanish Americans and unemployment rate among population between the ages 30 and 34 in the United States with a correlation coefficient (R) of 0.836 and weighted average of 6.2%, a difference of 2.8%.
Unemployment Among Ages 30 to 34 years Correlation Summary
| Measurement | Tlingit-Haida | Spanish American |
| Minimum | 0.60% | 0.50% |
| Maximum | 50.0% | 100.0% |
| Range | 49.4% | 99.5% |
| Mean | 13.3% | 15.6% |
| Median | 5.9% | 7.6% |
| Interquartile 25% (IQ1) | 3.5% | 5.5% |
| Interquartile 75% (IQ3) | 21.6% | 15.9% |
| Interquartile Range (IQR) | 18.1% | 10.4% |
| Standard Deviation (Sample) | 14.3% | 21.4% |
| Standard Deviation (Population) | 14.0% | 20.9% |
Demographics Similar to Tlingit-Haida and Spanish Americans by Unemployment Among Ages 30 to 34 years
In terms of unemployment among ages 30 to 34 years, the demographic groups most similar to Tlingit-Haida are Potawatomi (6.0%, a difference of 0.020%), Immigrants from Honduras (6.0%, a difference of 0.20%), Immigrants from Guatemala (6.0%, a difference of 0.29%), Honduran (6.0%, a difference of 0.29%), and Nigerian (6.0%, a difference of 0.30%). Similarly, the demographic groups most similar to Spanish Americans are Chickasaw (6.2%, a difference of 0.050%), American (6.2%, a difference of 0.15%), Seminole (6.2%, a difference of 0.25%), Immigrants from Mexico (6.2%, a difference of 0.45%), and Immigrants from Central America (6.2%, a difference of 0.50%).
| Demographics | Rating | Rank | Unemployment Among Ages 30 to 34 years |
| Nigerians | 0.3 /100 | #247 | Tragic 6.0% |
| Immigrants | Guatemala | 0.3 /100 | #248 | Tragic 6.0% |
| Hondurans | 0.3 /100 | #249 | Tragic 6.0% |
| Immigrants | Honduras | 0.3 /100 | #250 | Tragic 6.0% |
| Tlingit-Haida | 0.2 /100 | #251 | Tragic 6.0% |
| Potawatomi | 0.2 /100 | #252 | Tragic 6.0% |
| Immigrants | Nonimmigrants | 0.2 /100 | #253 | Tragic 6.1% |
| Armenians | 0.1 /100 | #254 | Tragic 6.1% |
| Immigrants | Portugal | 0.1 /100 | #255 | Tragic 6.1% |
| Immigrants | Ghana | 0.1 /100 | #256 | Tragic 6.1% |
| Immigrants | Sierra Leone | 0.1 /100 | #257 | Tragic 6.1% |
| Mexicans | 0.1 /100 | #258 | Tragic 6.1% |
| Haitians | 0.1 /100 | #259 | Tragic 6.1% |
| Immigrants | Latin America | 0.1 /100 | #260 | Tragic 6.1% |
| Immigrants | Western Africa | 0.1 /100 | #261 | Tragic 6.2% |
| Immigrants | Central America | 0.1 /100 | #262 | Tragic 6.2% |
| Spanish Americans | 0.0 /100 | #263 | Tragic 6.2% |
| Chickasaw | 0.0 /100 | #264 | Tragic 6.2% |
| Americans | 0.0 /100 | #265 | Tragic 6.2% |
| Seminole | 0.0 /100 | #266 | Tragic 6.2% |
| Immigrants | Mexico | 0.0 /100 | #267 | Tragic 6.2% |