Delaware vs Slavic Disability Age 35 to 64
COMPARE
Delaware
Slavic
Disability Age 35 to 64
Disability Age 35 to 64 Comparison
Delaware
Slavs
13.7%
DISABILITY AGE 35 TO 64
0.0/ 100
METRIC RATING
300th/ 347
METRIC RANK
11.7%
DISABILITY AGE 35 TO 64
15.5/ 100
METRIC RATING
205th/ 347
METRIC RANK
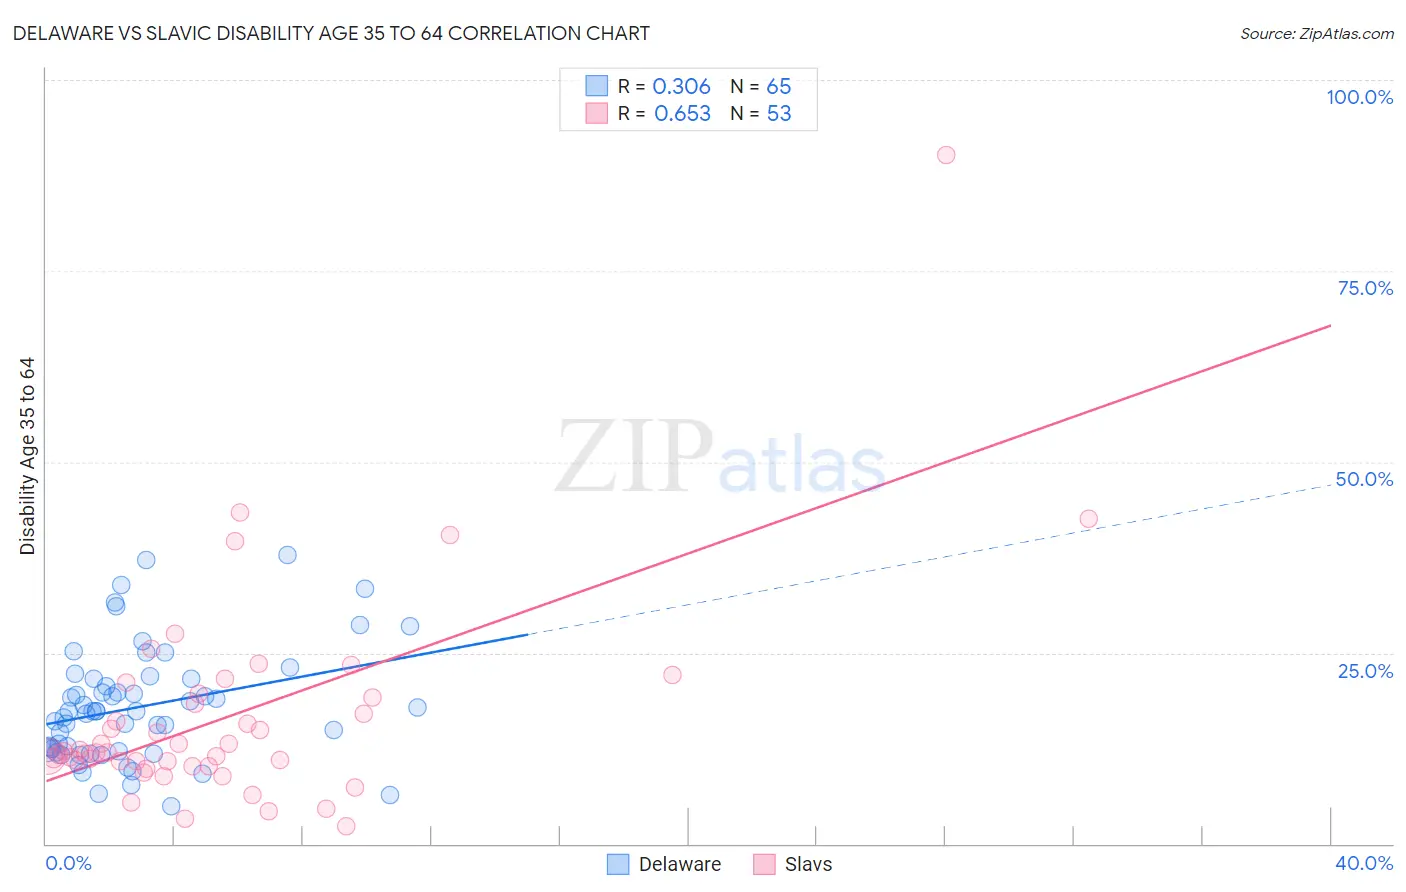
Delaware vs Slavic Disability Age 35 to 64 Correlation Chart
The statistical analysis conducted on geographies consisting of 96,224,166 people shows a mild positive correlation between the proportion of Delaware and percentage of population with a disability between the ages 34 and 64 in the United States with a correlation coefficient (R) of 0.306 and weighted average of 13.7%. Similarly, the statistical analysis conducted on geographies consisting of 270,786,875 people shows a significant positive correlation between the proportion of Slavs and percentage of population with a disability between the ages 34 and 64 in the United States with a correlation coefficient (R) of 0.653 and weighted average of 11.7%, a difference of 17.3%.
Disability Age 35 to 64 Correlation Summary
| Measurement | Delaware | Slavic |
| Minimum | 4.9% | 2.3% |
| Maximum | 37.7% | 90.1% |
| Range | 32.8% | 87.9% |
| Mean | 17.9% | 16.7% |
| Median | 17.3% | 12.0% |
| Interquartile 25% (IQ1) | 12.2% | 10.5% |
| Interquartile 75% (IQ3) | 21.6% | 19.5% |
| Interquartile Range (IQR) | 9.4% | 9.0% |
| Standard Deviation (Sample) | 7.4% | 13.9% |
| Standard Deviation (Population) | 7.4% | 13.8% |
Similar Demographics by Disability Age 35 to 64
Demographics Similar to Delaware by Disability Age 35 to 64
In terms of disability age 35 to 64, the demographic groups most similar to Delaware are Spanish American (13.7%, a difference of 0.080%), Cheyenne (13.6%, a difference of 0.28%), French American Indian (13.7%, a difference of 0.30%), Bangladeshi (13.6%, a difference of 0.31%), and African (13.6%, a difference of 0.66%).
| Demographics | Rating | Rank | Disability Age 35 to 64 |
| Ute | 0.0 /100 | #293 | Tragic 13.4% |
| Yaqui | 0.0 /100 | #294 | Tragic 13.5% |
| Yakama | 0.0 /100 | #295 | Tragic 13.6% |
| Africans | 0.0 /100 | #296 | Tragic 13.6% |
| Bangladeshis | 0.0 /100 | #297 | Tragic 13.6% |
| Cheyenne | 0.0 /100 | #298 | Tragic 13.6% |
| Spanish Americans | 0.0 /100 | #299 | Tragic 13.7% |
| Delaware | 0.0 /100 | #300 | Tragic 13.7% |
| French American Indians | 0.0 /100 | #301 | Tragic 13.7% |
| Aleuts | 0.0 /100 | #302 | Tragic 13.8% |
| Sioux | 0.0 /100 | #303 | Tragic 13.9% |
| Hopi | 0.0 /100 | #304 | Tragic 13.9% |
| Americans | 0.0 /100 | #305 | Tragic 13.9% |
| Immigrants | Yemen | 0.0 /100 | #306 | Tragic 14.0% |
| Blackfeet | 0.0 /100 | #307 | Tragic 14.1% |
Demographics Similar to Slavs by Disability Age 35 to 64
In terms of disability age 35 to 64, the demographic groups most similar to Slavs are Native Hawaiian (11.7%, a difference of 0.10%), Ghanaian (11.7%, a difference of 0.10%), Nigerian (11.6%, a difference of 0.11%), Guatemalan (11.7%, a difference of 0.13%), and British (11.6%, a difference of 0.22%).
| Demographics | Rating | Rank | Disability Age 35 to 64 |
| Immigrants | Panama | 20.4 /100 | #198 | Fair 11.6% |
| Basques | 19.5 /100 | #199 | Poor 11.6% |
| Swiss | 18.7 /100 | #200 | Poor 11.6% |
| Immigrants | Kenya | 17.7 /100 | #201 | Poor 11.6% |
| Immigrants | Guatemala | 17.5 /100 | #202 | Poor 11.6% |
| British | 17.0 /100 | #203 | Poor 11.6% |
| Nigerians | 16.3 /100 | #204 | Poor 11.6% |
| Slavs | 15.5 /100 | #205 | Poor 11.7% |
| Native Hawaiians | 14.8 /100 | #206 | Poor 11.7% |
| Ghanaians | 14.8 /100 | #207 | Poor 11.7% |
| Guatemalans | 14.6 /100 | #208 | Poor 11.7% |
| Europeans | 13.5 /100 | #209 | Poor 11.7% |
| Belgians | 13.1 /100 | #210 | Poor 11.7% |
| Canadians | 13.0 /100 | #211 | Poor 11.7% |
| Immigrants | Jamaica | 11.8 /100 | #212 | Poor 11.7% |