Subsaharan African vs Slavic Disability Age 35 to 64
COMPARE
Subsaharan African
Slavic
Disability Age 35 to 64
Disability Age 35 to 64 Comparison
Sub-Saharan Africans
Slavs
12.6%
DISABILITY AGE 35 TO 64
0.2/ 100
METRIC RATING
267th/ 347
METRIC RANK
11.7%
DISABILITY AGE 35 TO 64
15.5/ 100
METRIC RATING
205th/ 347
METRIC RANK
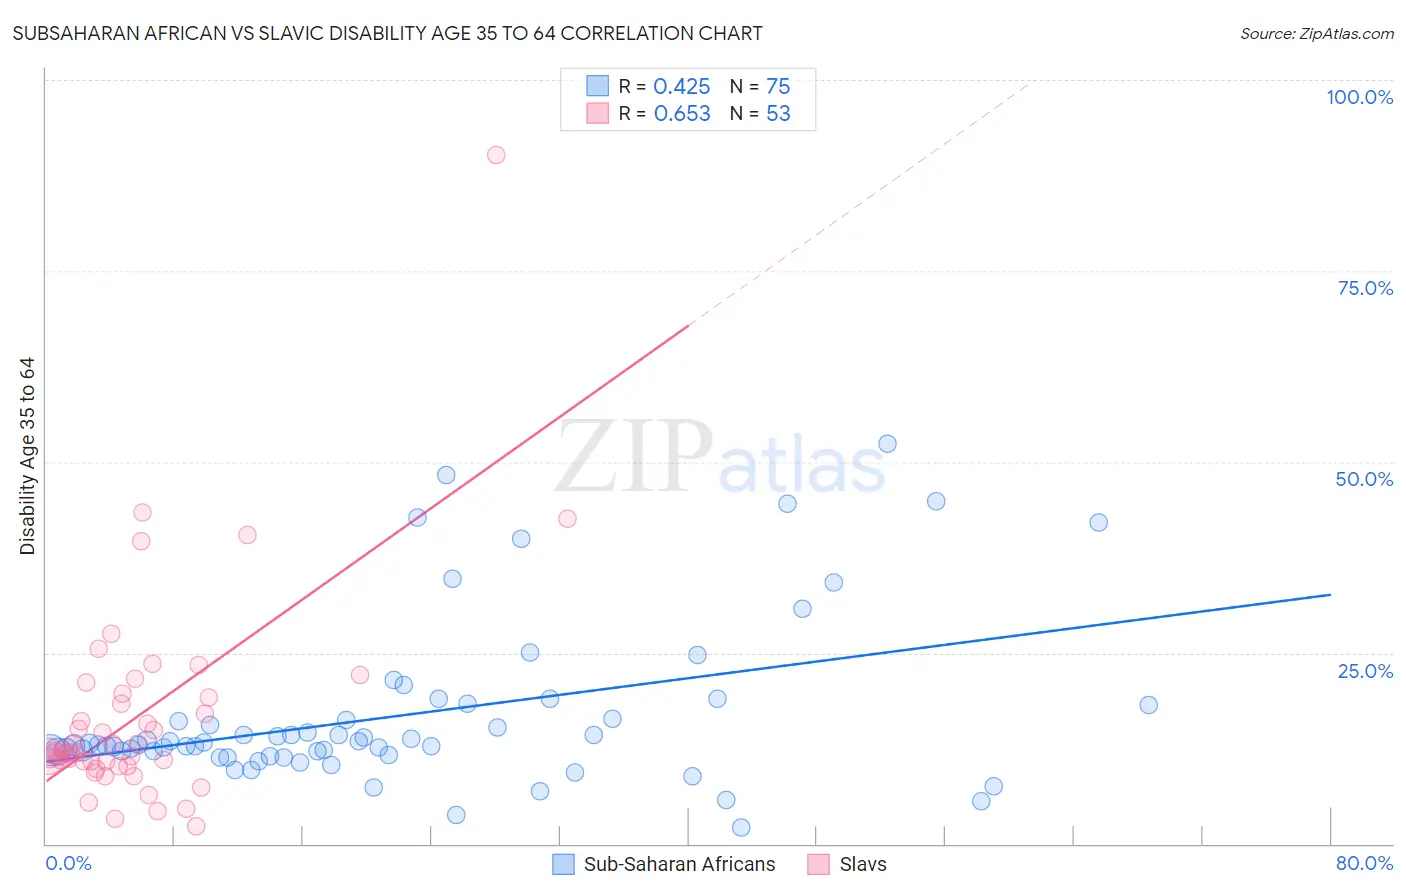
Subsaharan African vs Slavic Disability Age 35 to 64 Correlation Chart
The statistical analysis conducted on geographies consisting of 507,479,662 people shows a moderate positive correlation between the proportion of Sub-Saharan Africans and percentage of population with a disability between the ages 34 and 64 in the United States with a correlation coefficient (R) of 0.425 and weighted average of 12.6%. Similarly, the statistical analysis conducted on geographies consisting of 270,786,875 people shows a significant positive correlation between the proportion of Slavs and percentage of population with a disability between the ages 34 and 64 in the United States with a correlation coefficient (R) of 0.653 and weighted average of 11.7%, a difference of 8.5%.
Disability Age 35 to 64 Correlation Summary
| Measurement | Subsaharan African | Slavic |
| Minimum | 2.2% | 2.3% |
| Maximum | 52.4% | 90.1% |
| Range | 50.2% | 87.9% |
| Mean | 16.8% | 16.7% |
| Median | 12.9% | 12.0% |
| Interquartile 25% (IQ1) | 11.6% | 10.5% |
| Interquartile 75% (IQ3) | 18.2% | 19.5% |
| Interquartile Range (IQR) | 6.5% | 9.0% |
| Standard Deviation (Sample) | 10.7% | 13.9% |
| Standard Deviation (Population) | 10.7% | 13.8% |
Similar Demographics by Disability Age 35 to 64
Demographics Similar to Sub-Saharan Africans by Disability Age 35 to 64
In terms of disability age 35 to 64, the demographic groups most similar to Sub-Saharan Africans are White/Caucasian (12.6%, a difference of 0.16%), Immigrants from Dominica (12.7%, a difference of 0.18%), Spanish (12.7%, a difference of 0.28%), French (12.7%, a difference of 0.33%), and Marshallese (12.5%, a difference of 0.86%).
| Demographics | Rating | Rank | Disability Age 35 to 64 |
| German Russians | 0.5 /100 | #260 | Tragic 12.5% |
| Malaysians | 0.5 /100 | #261 | Tragic 12.5% |
| Senegalese | 0.5 /100 | #262 | Tragic 12.5% |
| Immigrants | Zaire | 0.4 /100 | #263 | Tragic 12.5% |
| Immigrants | Portugal | 0.4 /100 | #264 | Tragic 12.5% |
| Marshallese | 0.4 /100 | #265 | Tragic 12.5% |
| Whites/Caucasians | 0.3 /100 | #266 | Tragic 12.6% |
| Sub-Saharan Africans | 0.2 /100 | #267 | Tragic 12.6% |
| Immigrants | Dominica | 0.2 /100 | #268 | Tragic 12.7% |
| Spanish | 0.2 /100 | #269 | Tragic 12.7% |
| French | 0.2 /100 | #270 | Tragic 12.7% |
| Nepalese | 0.1 /100 | #271 | Tragic 12.8% |
| U.S. Virgin Islanders | 0.1 /100 | #272 | Tragic 12.8% |
| Pennsylvania Germans | 0.1 /100 | #273 | Tragic 12.8% |
| Celtics | 0.1 /100 | #274 | Tragic 12.9% |
Demographics Similar to Slavs by Disability Age 35 to 64
In terms of disability age 35 to 64, the demographic groups most similar to Slavs are Native Hawaiian (11.7%, a difference of 0.10%), Ghanaian (11.7%, a difference of 0.10%), Nigerian (11.6%, a difference of 0.11%), Guatemalan (11.7%, a difference of 0.13%), and British (11.6%, a difference of 0.22%).
| Demographics | Rating | Rank | Disability Age 35 to 64 |
| Immigrants | Panama | 20.4 /100 | #198 | Fair 11.6% |
| Basques | 19.5 /100 | #199 | Poor 11.6% |
| Swiss | 18.7 /100 | #200 | Poor 11.6% |
| Immigrants | Kenya | 17.7 /100 | #201 | Poor 11.6% |
| Immigrants | Guatemala | 17.5 /100 | #202 | Poor 11.6% |
| British | 17.0 /100 | #203 | Poor 11.6% |
| Nigerians | 16.3 /100 | #204 | Poor 11.6% |
| Slavs | 15.5 /100 | #205 | Poor 11.7% |
| Native Hawaiians | 14.8 /100 | #206 | Poor 11.7% |
| Ghanaians | 14.8 /100 | #207 | Poor 11.7% |
| Guatemalans | 14.6 /100 | #208 | Poor 11.7% |
| Europeans | 13.5 /100 | #209 | Poor 11.7% |
| Belgians | 13.1 /100 | #210 | Poor 11.7% |
| Canadians | 13.0 /100 | #211 | Poor 11.7% |
| Immigrants | Jamaica | 11.8 /100 | #212 | Poor 11.7% |