Swedish vs Laotian Disability Age 65 to 74
COMPARE
Swedish
Laotian
Disability Age 65 to 74
Disability Age 65 to 74 Comparison
Swedes
Laotians
22.4%
DISABILITY AGE 65 TO 74
94.7/ 100
METRIC RATING
117th/ 347
METRIC RANK
22.3%
DISABILITY AGE 65 TO 74
94.9/ 100
METRIC RATING
115th/ 347
METRIC RANK
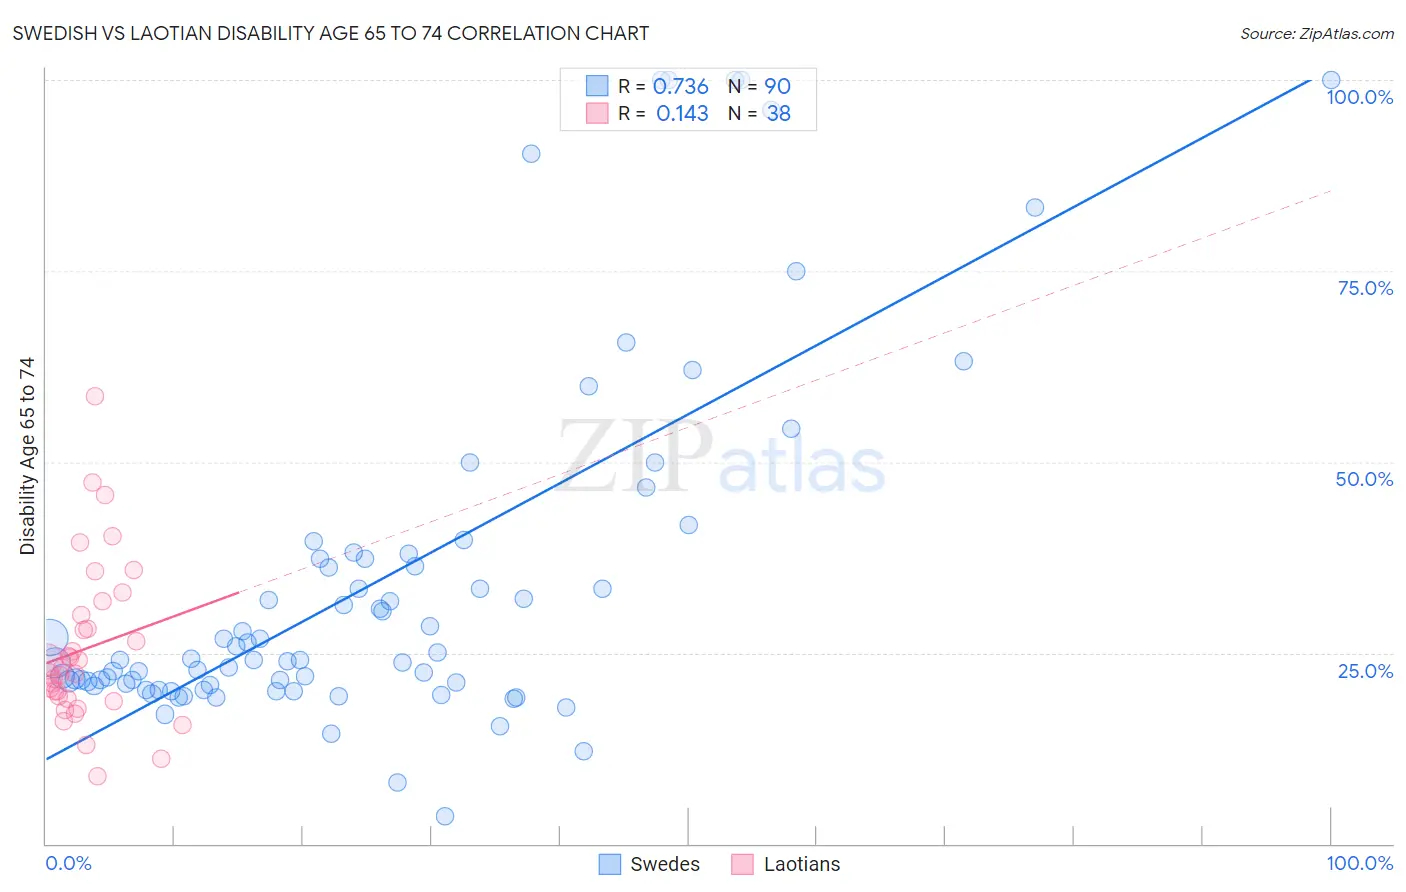
Swedish vs Laotian Disability Age 65 to 74 Correlation Chart
The statistical analysis conducted on geographies consisting of 537,372,214 people shows a strong positive correlation between the proportion of Swedes and percentage of population with a disability between the ages 65 and 75 in the United States with a correlation coefficient (R) of 0.736 and weighted average of 22.4%. Similarly, the statistical analysis conducted on geographies consisting of 224,537,885 people shows a poor positive correlation between the proportion of Laotians and percentage of population with a disability between the ages 65 and 75 in the United States with a correlation coefficient (R) of 0.143 and weighted average of 22.3%, a difference of 0.050%.
Disability Age 65 to 74 Correlation Summary
| Measurement | Swedish | Laotian |
| Minimum | 3.7% | 8.9% |
| Maximum | 100.0% | 58.7% |
| Range | 96.3% | 49.8% |
| Mean | 34.3% | 25.5% |
| Median | 24.0% | 22.7% |
| Interquartile 25% (IQ1) | 20.8% | 19.0% |
| Interquartile 75% (IQ3) | 37.4% | 29.9% |
| Interquartile Range (IQR) | 16.6% | 10.9% |
| Standard Deviation (Sample) | 23.2% | 10.5% |
| Standard Deviation (Population) | 23.0% | 10.3% |
Demographics Similar to Swedes and Laotians by Disability Age 65 to 74
In terms of disability age 65 to 74, the demographic groups most similar to Swedes are Austrian (22.4%, a difference of 0.0%), Brazilian (22.4%, a difference of 0.010%), Immigrants from Northern Africa (22.4%, a difference of 0.010%), Ukrainian (22.3%, a difference of 0.12%), and Syrian (22.3%, a difference of 0.20%). Similarly, the demographic groups most similar to Laotians are Brazilian (22.4%, a difference of 0.040%), Ukrainian (22.3%, a difference of 0.060%), Austrian (22.4%, a difference of 0.060%), Immigrants from Northern Africa (22.4%, a difference of 0.060%), and Syrian (22.3%, a difference of 0.15%).
| Demographics | Rating | Rank | Disability Age 65 to 74 |
| Peruvians | 96.1 /100 | #106 | Exceptional 22.2% |
| Slovenes | 96.1 /100 | #107 | Exceptional 22.2% |
| Immigrants | Zimbabwe | 96.1 /100 | #108 | Exceptional 22.3% |
| Albanians | 95.8 /100 | #109 | Exceptional 22.3% |
| Immigrants | Peru | 95.7 /100 | #110 | Exceptional 22.3% |
| Serbians | 95.7 /100 | #111 | Exceptional 22.3% |
| Immigrants | South America | 95.5 /100 | #112 | Exceptional 22.3% |
| Syrians | 95.3 /100 | #113 | Exceptional 22.3% |
| Ukrainians | 95.1 /100 | #114 | Exceptional 22.3% |
| Laotians | 94.9 /100 | #115 | Exceptional 22.3% |
| Brazilians | 94.8 /100 | #116 | Exceptional 22.4% |
| Swedes | 94.7 /100 | #117 | Exceptional 22.4% |
| Austrians | 94.7 /100 | #118 | Exceptional 22.4% |
| Immigrants | Northern Africa | 94.7 /100 | #119 | Exceptional 22.4% |
| Immigrants | Kazakhstan | 93.9 /100 | #120 | Exceptional 22.4% |
| Czechs | 93.5 /100 | #121 | Exceptional 22.4% |
| Immigrants | Jordan | 93.5 /100 | #122 | Exceptional 22.4% |
| Hungarians | 93.3 /100 | #123 | Exceptional 22.4% |
| Norwegians | 92.5 /100 | #124 | Exceptional 22.5% |
| Immigrants | Western Europe | 92.3 /100 | #125 | Exceptional 22.5% |
| Lebanese | 92.2 /100 | #126 | Exceptional 22.5% |