Afghan vs Laotian Disability Age 65 to 74
COMPARE
Afghan
Laotian
Disability Age 65 to 74
Disability Age 65 to 74 Comparison
Afghans
Laotians
22.6%
DISABILITY AGE 65 TO 74
88.6/ 100
METRIC RATING
134th/ 347
METRIC RANK
22.3%
DISABILITY AGE 65 TO 74
94.9/ 100
METRIC RATING
115th/ 347
METRIC RANK
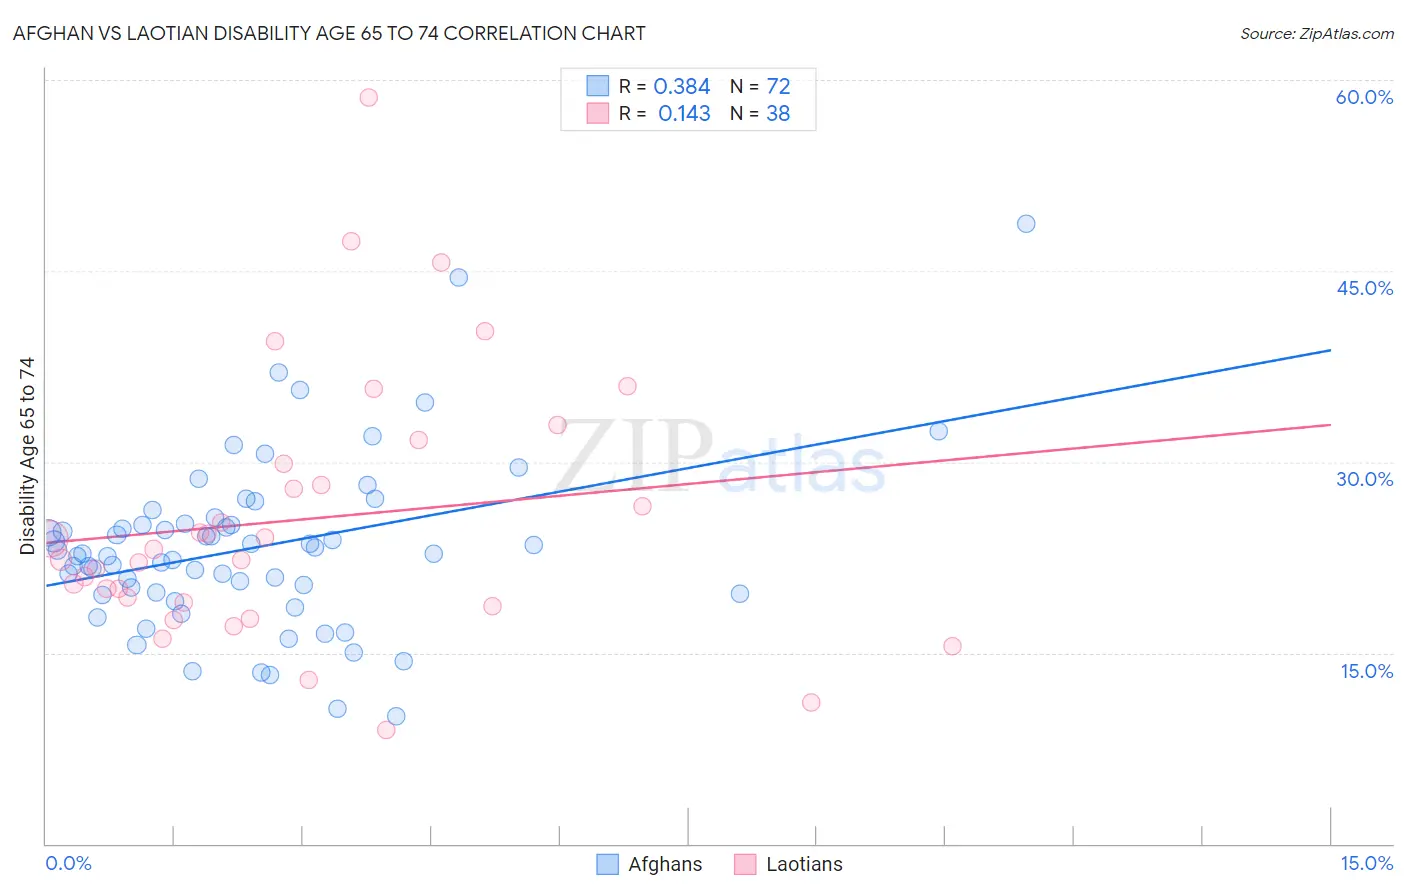
Afghan vs Laotian Disability Age 65 to 74 Correlation Chart
The statistical analysis conducted on geographies consisting of 148,797,358 people shows a mild positive correlation between the proportion of Afghans and percentage of population with a disability between the ages 65 and 75 in the United States with a correlation coefficient (R) of 0.384 and weighted average of 22.6%. Similarly, the statistical analysis conducted on geographies consisting of 224,537,885 people shows a poor positive correlation between the proportion of Laotians and percentage of population with a disability between the ages 65 and 75 in the United States with a correlation coefficient (R) of 0.143 and weighted average of 22.3%, a difference of 1.3%.
Disability Age 65 to 74 Correlation Summary
| Measurement | Afghan | Laotian |
| Minimum | 10.0% | 8.9% |
| Maximum | 48.7% | 58.7% |
| Range | 38.7% | 49.8% |
| Mean | 23.3% | 25.5% |
| Median | 22.8% | 22.7% |
| Interquartile 25% (IQ1) | 19.7% | 19.0% |
| Interquartile 75% (IQ3) | 25.1% | 29.9% |
| Interquartile Range (IQR) | 5.4% | 10.9% |
| Standard Deviation (Sample) | 6.7% | 10.5% |
| Standard Deviation (Population) | 6.7% | 10.3% |
Demographics Similar to Afghans and Laotians by Disability Age 65 to 74
In terms of disability age 65 to 74, the demographic groups most similar to Afghans are Northern European (22.6%, a difference of 0.050%), Costa Rican (22.6%, a difference of 0.10%), Immigrants from Nepal (22.6%, a difference of 0.13%), Immigrants from Albania (22.6%, a difference of 0.22%), and Immigrants from Uruguay (22.6%, a difference of 0.23%). Similarly, the demographic groups most similar to Laotians are Brazilian (22.4%, a difference of 0.040%), Swedish (22.4%, a difference of 0.050%), Ukrainian (22.3%, a difference of 0.060%), Austrian (22.4%, a difference of 0.060%), and Immigrants from Northern Africa (22.4%, a difference of 0.060%).
| Demographics | Rating | Rank | Disability Age 65 to 74 |
| Ukrainians | 95.1 /100 | #114 | Exceptional 22.3% |
| Laotians | 94.9 /100 | #115 | Exceptional 22.3% |
| Brazilians | 94.8 /100 | #116 | Exceptional 22.4% |
| Swedes | 94.7 /100 | #117 | Exceptional 22.4% |
| Austrians | 94.7 /100 | #118 | Exceptional 22.4% |
| Immigrants | Northern Africa | 94.7 /100 | #119 | Exceptional 22.4% |
| Immigrants | Kazakhstan | 93.9 /100 | #120 | Exceptional 22.4% |
| Czechs | 93.5 /100 | #121 | Exceptional 22.4% |
| Immigrants | Jordan | 93.5 /100 | #122 | Exceptional 22.4% |
| Hungarians | 93.3 /100 | #123 | Exceptional 22.4% |
| Norwegians | 92.5 /100 | #124 | Exceptional 22.5% |
| Immigrants | Western Europe | 92.3 /100 | #125 | Exceptional 22.5% |
| Lebanese | 92.2 /100 | #126 | Exceptional 22.5% |
| Slovaks | 91.6 /100 | #127 | Exceptional 22.5% |
| Immigrants | Costa Rica | 90.4 /100 | #128 | Exceptional 22.6% |
| Immigrants | Uruguay | 90.1 /100 | #129 | Exceptional 22.6% |
| Immigrants | Albania | 90.0 /100 | #130 | Excellent 22.6% |
| Immigrants | Nepal | 89.4 /100 | #131 | Excellent 22.6% |
| Costa Ricans | 89.2 /100 | #132 | Excellent 22.6% |
| Northern Europeans | 88.9 /100 | #133 | Excellent 22.6% |
| Afghans | 88.6 /100 | #134 | Excellent 22.6% |