Tlingit-Haida vs Cuban No Schooling Completed
COMPARE
Tlingit-Haida
Cuban
No Schooling Completed
No Schooling Completed Comparison
Tlingit-Haida
Cubans
1.5%
NO SCHOOLING COMPLETED
100.0/ 100
METRIC RATING
15th/ 347
METRIC RANK
2.5%
NO SCHOOLING COMPLETED
0.2/ 100
METRIC RATING
271st/ 347
METRIC RANK
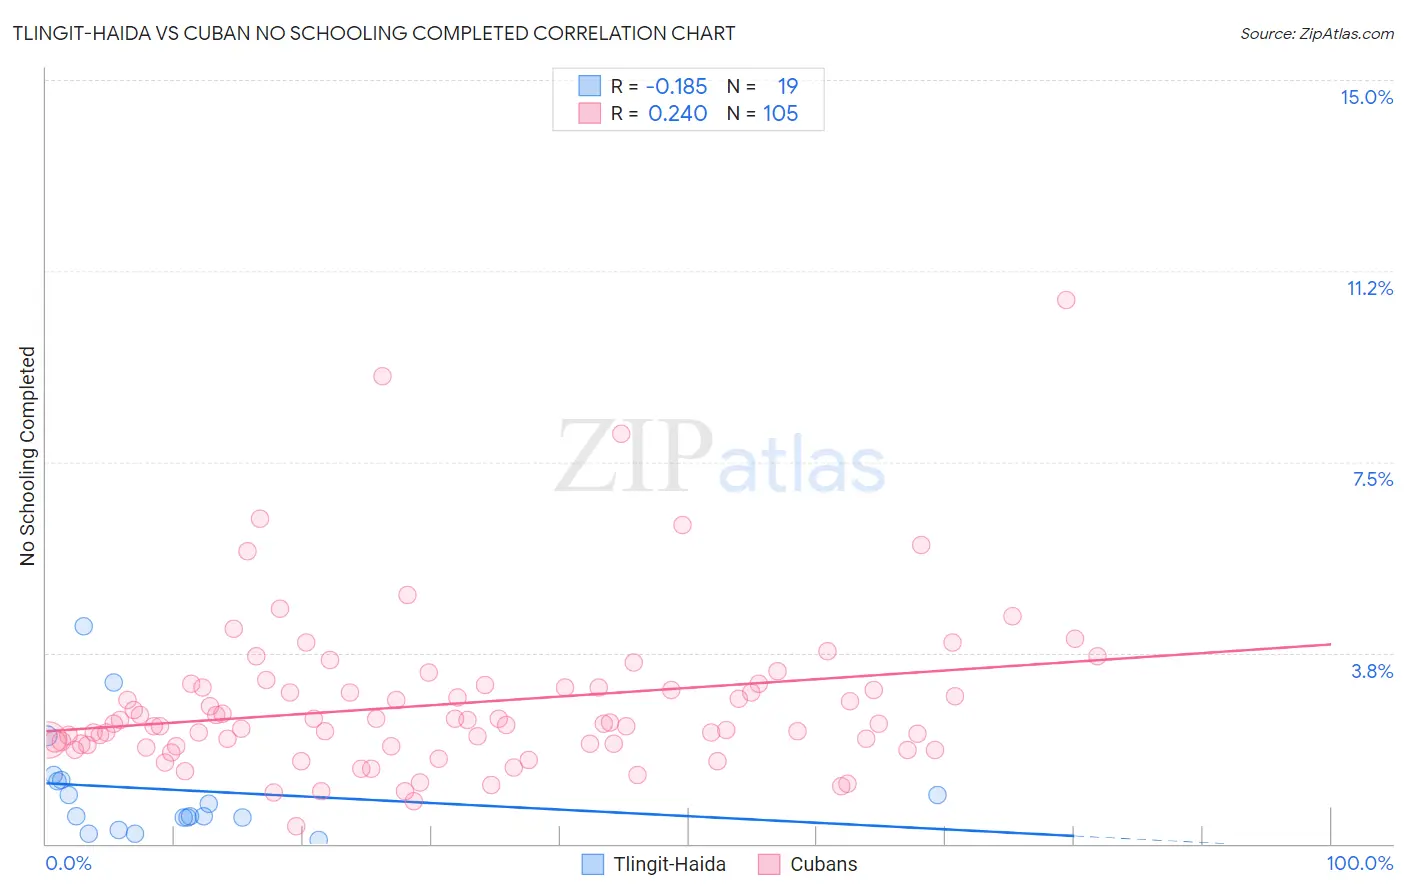
Tlingit-Haida vs Cuban No Schooling Completed Correlation Chart
The statistical analysis conducted on geographies consisting of 60,521,885 people shows a poor negative correlation between the proportion of Tlingit-Haida and percentage of population with no schooling in the United States with a correlation coefficient (R) of -0.185 and weighted average of 1.5%. Similarly, the statistical analysis conducted on geographies consisting of 444,053,579 people shows a weak positive correlation between the proportion of Cubans and percentage of population with no schooling in the United States with a correlation coefficient (R) of 0.240 and weighted average of 2.5%, a difference of 73.2%.
No Schooling Completed Correlation Summary
| Measurement | Tlingit-Haida | Cuban |
| Minimum | 0.064% | 0.33% |
| Maximum | 4.3% | 10.7% |
| Range | 4.2% | 10.4% |
| Mean | 1.1% | 2.8% |
| Median | 0.55% | 2.4% |
| Interquartile 25% (IQ1) | 0.51% | 1.9% |
| Interquartile 75% (IQ3) | 1.2% | 3.1% |
| Interquartile Range (IQR) | 0.74% | 1.1% |
| Standard Deviation (Sample) | 1.1% | 1.6% |
| Standard Deviation (Population) | 1.0% | 1.6% |
Similar Demographics by No Schooling Completed
Demographics Similar to Tlingit-Haida by No Schooling Completed
In terms of no schooling completed, the demographic groups most similar to Tlingit-Haida are Scotch-Irish (1.5%, a difference of 0.060%), Finnish (1.5%, a difference of 0.52%), Croatian (1.5%, a difference of 0.53%), Danish (1.5%, a difference of 0.84%), and Alaskan Athabascan (1.5%, a difference of 0.94%).
| Demographics | Rating | Rank | No Schooling Completed |
| Swedes | 100.0 /100 | #8 | Exceptional 1.4% |
| Scottish | 100.0 /100 | #9 | Exceptional 1.4% |
| Dutch | 100.0 /100 | #10 | Exceptional 1.4% |
| Lithuanians | 100.0 /100 | #11 | Exceptional 1.4% |
| Irish | 100.0 /100 | #12 | Exceptional 1.4% |
| Poles | 100.0 /100 | #13 | Exceptional 1.4% |
| Scotch-Irish | 100.0 /100 | #14 | Exceptional 1.5% |
| Tlingit-Haida | 100.0 /100 | #15 | Exceptional 1.5% |
| Finns | 100.0 /100 | #16 | Exceptional 1.5% |
| Croatians | 100.0 /100 | #17 | Exceptional 1.5% |
| Danes | 100.0 /100 | #18 | Exceptional 1.5% |
| Alaskan Athabascans | 100.0 /100 | #19 | Exceptional 1.5% |
| Welsh | 100.0 /100 | #20 | Exceptional 1.5% |
| Chinese | 100.0 /100 | #21 | Exceptional 1.5% |
| Alaska Natives | 100.0 /100 | #22 | Exceptional 1.5% |
Demographics Similar to Cubans by No Schooling Completed
In terms of no schooling completed, the demographic groups most similar to Cubans are Immigrants from Peru (2.5%, a difference of 0.010%), Immigrants from Nigeria (2.5%, a difference of 0.090%), Immigrants from Bolivia (2.5%, a difference of 0.53%), Taiwanese (2.5%, a difference of 0.95%), and Yuman (2.5%, a difference of 1.2%).
| Demographics | Rating | Rank | No Schooling Completed |
| Indians (Asian) | 0.4 /100 | #264 | Tragic 2.5% |
| West Indians | 0.4 /100 | #265 | Tragic 2.5% |
| Fijians | 0.4 /100 | #266 | Tragic 2.5% |
| Yuman | 0.4 /100 | #267 | Tragic 2.5% |
| Taiwanese | 0.3 /100 | #268 | Tragic 2.5% |
| Immigrants | Nigeria | 0.2 /100 | #269 | Tragic 2.5% |
| Immigrants | Peru | 0.2 /100 | #270 | Tragic 2.5% |
| Cubans | 0.2 /100 | #271 | Tragic 2.5% |
| Immigrants | Bolivia | 0.2 /100 | #272 | Tragic 2.5% |
| Immigrants | Cameroon | 0.1 /100 | #273 | Tragic 2.5% |
| Ghanaians | 0.1 /100 | #274 | Tragic 2.6% |
| Immigrants | China | 0.1 /100 | #275 | Tragic 2.6% |
| Immigrants | Western Africa | 0.1 /100 | #276 | Tragic 2.6% |
| Immigrants | Philippines | 0.1 /100 | #277 | Tragic 2.6% |
| Immigrants | Uzbekistan | 0.1 /100 | #278 | Tragic 2.6% |