Tlingit-Haida vs Cuban Unemployment Among Women with Children Under 18 years

COMPARE

Tlingit-Haida
Race
Ancestry
AfghanAfricanAlaska NativeAlaskan AthabascanAlbanianAleutAlsatianAmericanApacheArabArapahoArgentineanArmenianAssyrian/Chaldean/SyriacAustralianAustrianBahamianBangladeshiBarbadianBasqueBelgianBelizeanBermudanBhutaneseBlackfeetBolivianBrazilianBritishBritish West IndianBulgarianBurmeseCajunCambodianCanadianCape VerdeanCarpatho RusynCelticCentral AmericanCentral American IndianCherokeeCheyenneChickasawChileanChineseChippewaChoctawColombianColvilleComancheCosta RicanCreeCreekCroatianCrowCypriotCzechCzechoslovakianDanishDelawareDominicanDutchDutch West IndianEastern EuropeanEcuadorianEgyptianEnglishEstonianEthiopianEuropeanFijianFilipinoFinnishFrenchFrench American IndianFrench CanadianGermanGerman RussianGhanaianGreekGuamanian/ChamorroGuatemalanGuyaneseHaitianHmongHonduranHopiHoumaHungarianIcelanderIndian (Asian)IndonesianInupiatIranianIraqiIrishIroquoisIsraeliItalianJamaicanJapaneseJordanianKenyanKiowaKoreanLaotianLatvianLebaneseLiberianLithuanianLumbeeLuxembourgerMacedonianMalaysianMalteseMarshalleseMenomineeMexicanMexican American IndianMongolianMoroccanNative HawaiianNavajoNepaleseNew ZealanderNicaraguanNigerianNorthern EuropeanNorwegianOkinawanOsageOttawaPaiutePakistaniPalestinianPanamanianParaguayanPennsylvania GermanPeruvianPimaPolishPortuguesePotawatomiPuebloPuerto RicanPuget Sound SalishRomanianRussianSalvadoranSamoanScandinavianScotch-IrishScottishSeminoleSenegaleseSerbianShoshoneSierra LeoneanSiouxSlavicSlovakSloveneSomaliSouth AfricanSouth AmericanSouth American IndianSoviet UnionSpaniardSpanishSpanish AmericanSpanish American IndianSri LankanSubsaharan AfricanSudaneseSwedishSwissSyrianTaiwaneseThaiTlingit-HaidaTohono O'OdhamTonganTrinidadian and TobagonianTsimshianTurkishU.S. Virgin IslanderUgandanUkrainianUruguayanUteVenezuelanVietnameseWelshWest IndianYakamaYaquiYugoslavianYumanYup'ikZimbabwean
Immigration
NonimmigrantsImmigrantsAfghanistanAfricaAlbaniaArgentinaArmeniaAsiaAustraliaAustriaBahamasBangladeshBarbadosBelarusBelgiumBelizeBoliviaBosnia and HerzegovinaBrazilBulgariaBurma/MyanmarCabo VerdeCambodiaCameroonCanadaCaribbeanCentral AmericaChileChinaColombiaCongoCosta RicaCroatiaCubaCzechoslovakiaDenmarkDominicaDominican RepublicEastern AfricaEastern AsiaEastern EuropeEcuadorEgyptEl SalvadorEnglandEritreaEthiopiaEuropeFijiFranceGermanyGhanaGreeceGrenadaGuatemalaGuyanaHaitiHondurasHong KongHungaryIndiaIndonesiaIranIraqIrelandIsraelItalyJamaicaJapanJordanKazakhstanKenyaKoreaKuwaitLaosLatin AmericaLatviaLebanonLiberiaLithuaniaMalaysiaMexicoMicronesiaMiddle AfricaMoldovaMoroccoNepalNetherlandsNicaraguaNigeriaNorth AmericaNorth MacedoniaNorthern AfricaNorthern EuropeNorwayOceaniaPakistanPanamaPeruPhilippinesPolandPortugalRomaniaRussiaSaudi ArabiaScotlandSenegalSerbiaSierra LeoneSingaporeSomaliaSouth AfricaSouth AmericaSouth Central AsiaSouth Eastern AsiaSouthern EuropeSpainSri LankaSt. Vincent and the GrenadinesSudanSwedenSwitzerlandSyriaTaiwanThailandTrinidad and TobagoTurkeyUgandaUkraineUruguayUzbekistanVenezuelaVietnamWest IndiesWestern AfricaWestern AsiaWestern EuropeYemenZaireZimbabweAzores
Cuban
Race
Ancestry
AfghanAfricanAlaska NativeAlaskan AthabascanAlbanianAleutAlsatianAmericanApacheArabArapahoArgentineanArmenianAssyrian/Chaldean/SyriacAustralianAustrianBahamianBangladeshiBarbadianBasqueBelgianBelizeanBermudanBhutaneseBlackfeetBolivianBrazilianBritishBritish West IndianBulgarianBurmeseCajunCambodianCanadianCape VerdeanCarpatho RusynCelticCentral AmericanCentral American IndianCherokeeCheyenneChickasawChileanChineseChippewaChoctawColombianColvilleComancheCosta RicanCreeCreekCroatianCrowCubanCypriotCzechCzechoslovakianDanishDelawareDominicanDutchDutch West IndianEastern EuropeanEcuadorianEgyptianEnglishEstonianEthiopianEuropeanFijianFilipinoFinnishFrenchFrench American IndianFrench CanadianGermanGerman RussianGhanaianGreekGuamanian/ChamorroGuatemalanGuyaneseHaitianHmongHonduranHopiHoumaHungarianIcelanderIndian (Asian)IndonesianInupiatIranianIraqiIrishIroquoisIsraeliItalianJamaicanJapaneseJordanianKenyanKiowaKoreanLaotianLatvianLebaneseLiberianLithuanianLumbeeLuxembourgerMacedonianMalaysianMalteseMarshalleseMenomineeMexicanMexican American IndianMongolianMoroccanNative HawaiianNavajoNepaleseNew ZealanderNicaraguanNigerianNorthern EuropeanNorwegianOkinawanOsageOttawaPaiutePakistaniPalestinianPanamanianParaguayanPennsylvania GermanPeruvianPimaPolishPortuguesePotawatomiPuebloPuerto RicanPuget Sound SalishRomanianRussianSalvadoranSamoanScandinavianScotch-IrishScottishSeminoleSenegaleseSerbianShoshoneSierra LeoneanSiouxSlavicSlovakSloveneSomaliSouth AfricanSouth AmericanSouth American IndianSoviet UnionSpaniardSpanishSpanish AmericanSpanish American IndianSri LankanSubsaharan AfricanSudaneseSwedishSwissSyrianTaiwaneseThaiTohono O'OdhamTonganTrinidadian and TobagonianTsimshianTurkishU.S. Virgin IslanderUgandanUkrainianUruguayanUteVenezuelanVietnameseWelshWest IndianYakamaYaquiYugoslavianYumanYup'ikZimbabwean
Immigration
NonimmigrantsImmigrantsAfghanistanAfricaAlbaniaArgentinaArmeniaAsiaAustraliaAustriaBahamasBangladeshBarbadosBelarusBelgiumBelizeBoliviaBosnia and HerzegovinaBrazilBulgariaBurma/MyanmarCabo VerdeCambodiaCameroonCanadaCaribbeanCentral AmericaChileChinaColombiaCongoCosta RicaCroatiaCubaCzechoslovakiaDenmarkDominicaDominican RepublicEastern AfricaEastern AsiaEastern EuropeEcuadorEgyptEl SalvadorEnglandEritreaEthiopiaEuropeFijiFranceGermanyGhanaGreeceGrenadaGuatemalaGuyanaHaitiHondurasHong KongHungaryIndiaIndonesiaIranIraqIrelandIsraelItalyJamaicaJapanJordanKazakhstanKenyaKoreaKuwaitLaosLatin AmericaLatviaLebanonLiberiaLithuaniaMalaysiaMexicoMicronesiaMiddle AfricaMoldovaMoroccoNepalNetherlandsNicaraguaNigeriaNorth AmericaNorth MacedoniaNorthern AfricaNorthern EuropeNorwayOceaniaPakistanPanamaPeruPhilippinesPolandPortugalRomaniaRussiaSaudi ArabiaScotlandSenegalSerbiaSierra LeoneSingaporeSomaliaSouth AfricaSouth AmericaSouth Central AsiaSouth Eastern AsiaSouthern EuropeSpainSri LankaSt. Vincent and the GrenadinesSudanSwedenSwitzerlandSyriaTaiwanThailandTrinidad and TobagoTurkeyUgandaUkraineUruguayUzbekistanVenezuelaVietnamWest IndiesWestern AfricaWestern AsiaWestern EuropeYemenZaireZimbabweAzores
Unemployment Among Women with Children Under 18 years
Income
Poverty
Unemployment
Labor Participation
Family Structure
Vehicle Availability
Education Level
Disability

Unemployment Among Women with Children Under 18 years Comparison

Tlingit-Haida

Cubans

Good
Exceptional
5.4%
UNEMPLOYMENT AMONG WOMEN WITH CHILDREN UNDER 18 YEARS
61.9/ 100
METRIC RATING
165th/ 347
METRIC RANK
5.2%
UNEMPLOYMENT AMONG WOMEN WITH CHILDREN UNDER 18 YEARS
91.8/ 100
METRIC RATING
99th/ 347
METRIC RANK

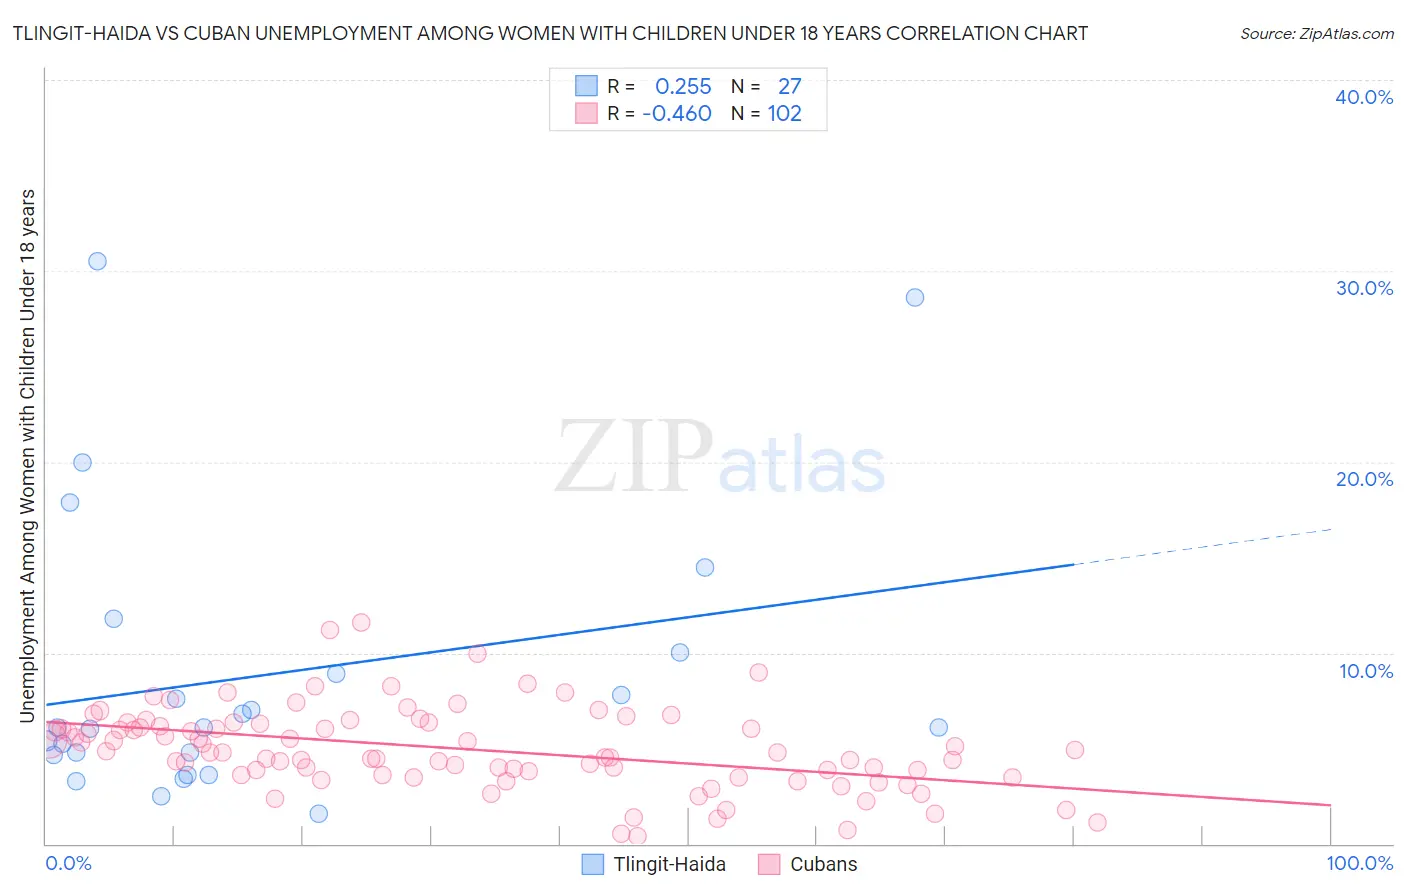
Tlingit-Haida vs Cuban Unemployment Among Women with Children Under 18 years Correlation Chart

The statistical analysis conducted on geographies consisting of 59,920,884 people shows a weak positive correlation between the proportion of Tlingit-Haida and unemployment rate among women with children under the age of 18 in the United States with a correlation coefficient (R) of 0.255 and weighted average of 5.4%. Similarly, the statistical analysis conducted on geographies consisting of 428,709,207 people shows a moderate negative correlation between the proportion of Cubans and unemployment rate among women with children under the age of 18 in the United States with a correlation coefficient (R) of -0.460 and weighted average of 5.2%, a difference of 3.6%.
Tlingit-Haida vs Cuban Unemployment Among Women with Children Under 18 years

Unemployment Among Women with Children Under 18 years Correlation Summary

MeasurementTlingit-HaidaCuban
Minimum1.6%0.40%
Maximum30.5%11.6%
Range28.9%11.2%
Mean8.8%5.0%
Median6.1%4.8%
Interquartile 25% (IQ1)4.7%3.6%
Interquartile 75% (IQ3)10.0%6.3%
Interquartile Range (IQR)5.3%2.7%
Standard Deviation (Sample)7.4%2.1%
Standard Deviation (Population)7.3%2.1%

Similar Demographics by Unemployment Among Women with Children Under 18 years

Demographics Similar to Tlingit-Haida by Unemployment Among Women with Children Under 18 years

In terms of unemployment among women with children under 18 years, the demographic groups most similar to Tlingit-Haida are Celtic (5.4%, a difference of 0.090%), Aleut (5.4%, a difference of 0.19%), Lebanese (5.4%, a difference of 0.22%), Immigrants from Saudi Arabia (5.4%, a difference of 0.24%), and Immigrants from Denmark (5.4%, a difference of 0.29%).
DemographicsRating | RankUnemployment Among Women with Children Under 18 years
Immigrants | Burma/Myanmar
69.5
/100
|
#158
Good
5.4%
Chickasaw
68.4
/100
|
#159
Good
5.4%
Afghans
66.6
/100
|
#160
Good
5.4%
Immigrants | Iraq
65.9
/100
|
#161
Good
5.4%
Immigrants | Saudi Arabia
65.0
/100
|
#162
Good
5.4%
Lebanese
64.7
/100
|
#163
Good
5.4%
Celtics
63.0
/100
|
#164
Good
5.4%
Tlingit-Haida
61.9
/100
|
#165
Good
5.4%
Aleuts
59.4
/100
|
#166
Average
5.4%
Immigrants | Denmark
58.0
/100
|
#167
Average
5.4%
Immigrants | Northern Africa
56.1
/100
|
#168
Average
5.4%
Immigrants | Thailand
55.3
/100
|
#169
Average
5.4%
Samoans
54.1
/100
|
#170
Average
5.4%
Immigrants | Philippines
53.1
/100
|
#171
Average
5.4%
Immigrants | Kazakhstan
51.7
/100
|
#172
Average
5.4%

Demographics Similar to Cubans by Unemployment Among Women with Children Under 18 years

In terms of unemployment among women with children under 18 years, the demographic groups most similar to Cubans are Immigrants from Vietnam (5.2%, a difference of 0.060%), Immigrants from Greece (5.2%, a difference of 0.090%), Immigrants from Albania (5.2%, a difference of 0.10%), Palestinian (5.2%, a difference of 0.10%), and Immigrants from North America (5.2%, a difference of 0.12%).
DemographicsRating | RankUnemployment Among Women with Children Under 18 years
Immigrants | Pakistan
93.3
/100
|
#92
Exceptional
5.2%
Immigrants | Canada
93.3
/100
|
#93
Exceptional
5.2%
Immigrants | Kuwait
92.6
/100
|
#94
Exceptional
5.2%
Immigrants | North America
92.3
/100
|
#95
Exceptional
5.2%
Immigrants | Albania
92.2
/100
|
#96
Exceptional
5.2%
Palestinians
92.2
/100
|
#97
Exceptional
5.2%
Immigrants | Vietnam
92.0
/100
|
#98
Exceptional
5.2%
Cubans
91.8
/100
|
#99
Exceptional
5.2%
Immigrants | Greece
91.4
/100
|
#100
Exceptional
5.2%
Immigrants | Netherlands
91.0
/100
|
#101
Exceptional
5.2%
Immigrants | Cuba
90.9
/100
|
#102
Exceptional
5.2%
Sri Lankans
90.3
/100
|
#103
Exceptional
5.2%
Immigrants | Switzerland
90.1
/100
|
#104
Exceptional
5.2%
Immigrants | France
90.0
/100
|
#105
Excellent
5.2%
Pakistanis
89.9
/100
|
#106
Excellent
5.2%