Immigrants from Eritrea vs Cuban Disability Age 65 to 74
COMPARE
Immigrants from Eritrea
Cuban
Disability Age 65 to 74
Disability Age 65 to 74 Comparison
Immigrants from Eritrea
Cubans
23.4%
DISABILITY AGE 65 TO 74
47.5/ 100
METRIC RATING
176th/ 347
METRIC RANK
23.3%
DISABILITY AGE 65 TO 74
51.9/ 100
METRIC RATING
171st/ 347
METRIC RANK
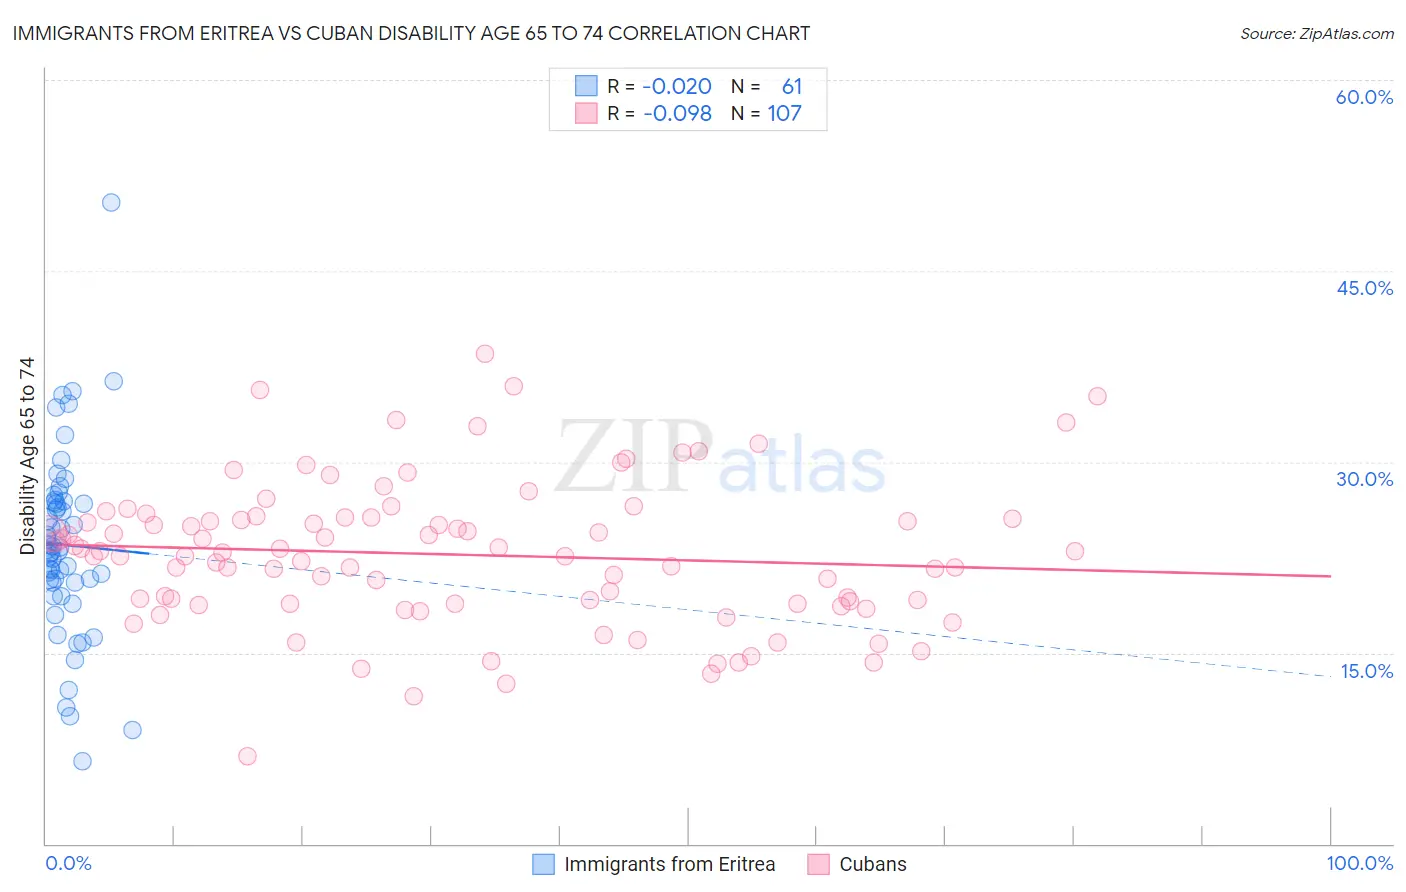
Immigrants from Eritrea vs Cuban Disability Age 65 to 74 Correlation Chart
The statistical analysis conducted on geographies consisting of 104,842,902 people shows no correlation between the proportion of Immigrants from Eritrea and percentage of population with a disability between the ages 65 and 75 in the United States with a correlation coefficient (R) of -0.020 and weighted average of 23.4%. Similarly, the statistical analysis conducted on geographies consisting of 448,265,538 people shows a slight negative correlation between the proportion of Cubans and percentage of population with a disability between the ages 65 and 75 in the United States with a correlation coefficient (R) of -0.098 and weighted average of 23.3%, a difference of 0.26%.
Disability Age 65 to 74 Correlation Summary
| Measurement | Immigrants from Eritrea | Cuban |
| Minimum | 6.5% | 6.9% |
| Maximum | 50.4% | 38.5% |
| Range | 43.9% | 31.6% |
| Mean | 23.5% | 22.7% |
| Median | 23.1% | 22.9% |
| Interquartile 25% (IQ1) | 20.5% | 18.9% |
| Interquartile 75% (IQ3) | 26.9% | 25.6% |
| Interquartile Range (IQR) | 6.4% | 6.7% |
| Standard Deviation (Sample) | 7.3% | 5.7% |
| Standard Deviation (Population) | 7.2% | 5.7% |
Demographics Similar to Immigrants from Eritrea and Cubans by Disability Age 65 to 74
In terms of disability age 65 to 74, the demographic groups most similar to Immigrants from Eritrea are Immigrants from Haiti (23.4%, a difference of 0.0%), Guyanese (23.4%, a difference of 0.10%), Immigrants from Sierra Leone (23.4%, a difference of 0.10%), Dutch (23.3%, a difference of 0.11%), and Scandinavian (23.4%, a difference of 0.12%). Similarly, the demographic groups most similar to Cubans are German (23.3%, a difference of 0.080%), Yugoslavian (23.3%, a difference of 0.10%), Immigrants from South Eastern Asia (23.3%, a difference of 0.11%), Moroccan (23.3%, a difference of 0.13%), and Icelander (23.3%, a difference of 0.14%).
| Demographics | Rating | Rank | Disability Age 65 to 74 |
| Immigrants | Philippines | 61.1 /100 | #163 | Good 23.2% |
| Sierra Leoneans | 60.9 /100 | #164 | Good 23.2% |
| Vietnamese | 60.8 /100 | #165 | Good 23.2% |
| Immigrants | Afghanistan | 60.5 /100 | #166 | Good 23.2% |
| Immigrants | Bosnia and Herzegovina | 57.6 /100 | #167 | Average 23.2% |
| Pakistanis | 57.0 /100 | #168 | Average 23.2% |
| Icelanders | 54.3 /100 | #169 | Average 23.3% |
| Moroccans | 54.2 /100 | #170 | Average 23.3% |
| Cubans | 51.9 /100 | #171 | Average 23.3% |
| Germans | 50.5 /100 | #172 | Average 23.3% |
| Yugoslavians | 50.2 /100 | #173 | Average 23.3% |
| Immigrants | South Eastern Asia | 50.0 /100 | #174 | Average 23.3% |
| Dutch | 49.4 /100 | #175 | Average 23.3% |
| Immigrants | Eritrea | 47.5 /100 | #176 | Average 23.4% |
| Immigrants | Haiti | 47.5 /100 | #177 | Average 23.4% |
| Guyanese | 45.8 /100 | #178 | Average 23.4% |
| Immigrants | Sierra Leone | 45.8 /100 | #179 | Average 23.4% |
| Scandinavians | 45.6 /100 | #180 | Average 23.4% |
| Assyrians/Chaldeans/Syriacs | 45.3 /100 | #181 | Average 23.4% |
| Irish | 44.4 /100 | #182 | Average 23.4% |
| Immigrants | Eastern Africa | 42.8 /100 | #183 | Average 23.4% |