Tlingit-Haida vs Cuban Unemployment
COMPARE
Tlingit-Haida
Cuban
Unemployment
Unemployment Comparison
Tlingit-Haida
Cubans
5.6%
UNEMPLOYMENT
2.0/ 100
METRIC RATING
241st/ 347
METRIC RANK
4.7%
UNEMPLOYMENT
99.8/ 100
METRIC RATING
28th/ 347
METRIC RANK
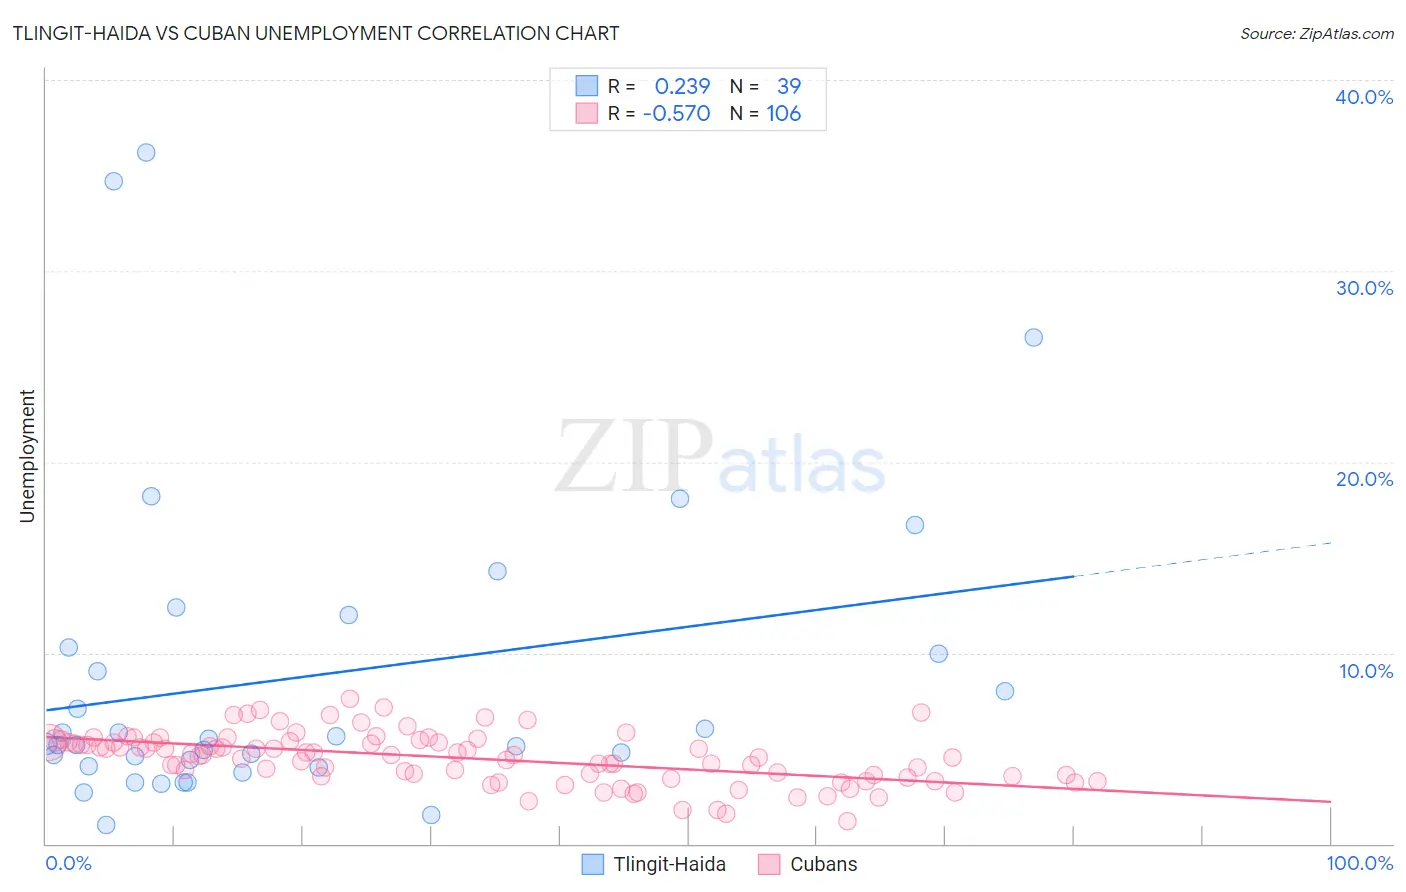
Tlingit-Haida vs Cuban Unemployment Correlation Chart
The statistical analysis conducted on geographies consisting of 60,829,172 people shows a weak positive correlation between the proportion of Tlingit-Haida and unemployment in the United States with a correlation coefficient (R) of 0.239 and weighted average of 5.6%. Similarly, the statistical analysis conducted on geographies consisting of 448,752,139 people shows a substantial negative correlation between the proportion of Cubans and unemployment in the United States with a correlation coefficient (R) of -0.570 and weighted average of 4.7%, a difference of 17.5%.
Unemployment Correlation Summary
| Measurement | Tlingit-Haida | Cuban |
| Minimum | 1.0% | 1.2% |
| Maximum | 36.2% | 7.6% |
| Range | 35.2% | 6.4% |
| Mean | 8.7% | 4.5% |
| Median | 5.2% | 4.7% |
| Interquartile 25% (IQ1) | 4.0% | 3.5% |
| Interquartile 75% (IQ3) | 10.3% | 5.3% |
| Interquartile Range (IQR) | 6.3% | 1.8% |
| Standard Deviation (Sample) | 8.2% | 1.3% |
| Standard Deviation (Population) | 8.1% | 1.3% |
Similar Demographics by Unemployment
Demographics Similar to Tlingit-Haida by Unemployment
In terms of unemployment, the demographic groups most similar to Tlingit-Haida are Spanish American (5.6%, a difference of 0.0%), Cree (5.6%, a difference of 0.34%), Immigrants (5.5%, a difference of 0.35%), Immigrants from Western Asia (5.5%, a difference of 0.44%), and Marshallese (5.6%, a difference of 0.64%).
| Demographics | Rating | Rank | Unemployment |
| Panamanians | 4.7 /100 | #234 | Tragic 5.5% |
| Immigrants | Panama | 3.4 /100 | #235 | Tragic 5.5% |
| Immigrants | Cambodia | 3.3 /100 | #236 | Tragic 5.5% |
| Moroccans | 3.2 /100 | #237 | Tragic 5.5% |
| Immigrants | Western Asia | 2.8 /100 | #238 | Tragic 5.5% |
| Immigrants | Immigrants | 2.6 /100 | #239 | Tragic 5.5% |
| Cree | 2.6 /100 | #240 | Tragic 5.6% |
| Tlingit-Haida | 2.0 /100 | #241 | Tragic 5.6% |
| Spanish Americans | 2.0 /100 | #242 | Tragic 5.6% |
| Marshallese | 1.3 /100 | #243 | Tragic 5.6% |
| Dutch West Indians | 1.2 /100 | #244 | Tragic 5.6% |
| French American Indians | 1.2 /100 | #245 | Tragic 5.6% |
| Bermudans | 1.1 /100 | #246 | Tragic 5.6% |
| Immigrants | Cameroon | 1.0 /100 | #247 | Tragic 5.6% |
| Liberians | 0.9 /100 | #248 | Tragic 5.6% |
Demographics Similar to Cubans by Unemployment
In terms of unemployment, the demographic groups most similar to Cubans are Polish (4.7%, a difference of 0.12%), Finnish (4.7%, a difference of 0.32%), Irish (4.8%, a difference of 0.36%), Croatian (4.8%, a difference of 0.38%), and Zimbabwean (4.8%, a difference of 0.48%).
| Demographics | Rating | Rank | Unemployment |
| Welsh | 99.9 /100 | #21 | Exceptional 4.7% |
| Thais | 99.9 /100 | #22 | Exceptional 4.7% |
| British | 99.9 /100 | #23 | Exceptional 4.7% |
| Venezuelans | 99.9 /100 | #24 | Exceptional 4.7% |
| Latvians | 99.9 /100 | #25 | Exceptional 4.7% |
| Bulgarians | 99.9 /100 | #26 | Exceptional 4.7% |
| Finns | 99.9 /100 | #27 | Exceptional 4.7% |
| Cubans | 99.8 /100 | #28 | Exceptional 4.7% |
| Poles | 99.8 /100 | #29 | Exceptional 4.7% |
| Irish | 99.8 /100 | #30 | Exceptional 4.8% |
| Croatians | 99.8 /100 | #31 | Exceptional 4.8% |
| Zimbabweans | 99.8 /100 | #32 | Exceptional 4.8% |
| Sudanese | 99.8 /100 | #33 | Exceptional 4.8% |
| Immigrants | Bolivia | 99.8 /100 | #34 | Exceptional 4.8% |
| Scotch-Irish | 99.8 /100 | #35 | Exceptional 4.8% |