Tlingit-Haida vs Bolivian Family Households with Children
COMPARE
Tlingit-Haida
Bolivian
Family Households with Children
Family Households with Children Comparison
Tlingit-Haida
Bolivians
26.0%
FAMILY HOUSEHOLDS WITH CHILDREN
0.0/ 100
METRIC RATING
320th/ 347
METRIC RANK
29.5%
FAMILY HOUSEHOLDS WITH CHILDREN
100.0/ 100
METRIC RATING
29th/ 347
METRIC RANK
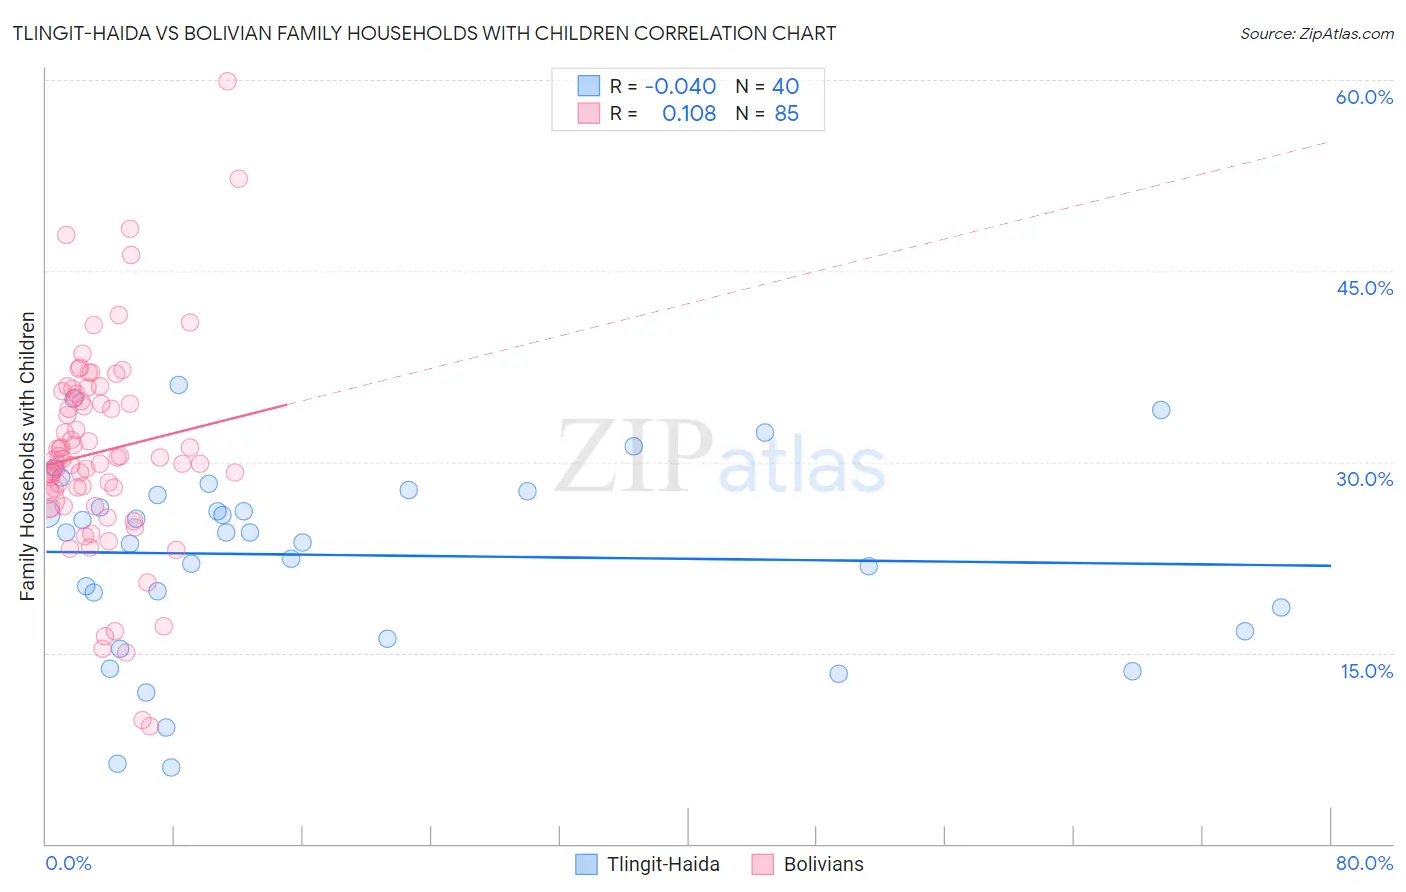
Tlingit-Haida vs Bolivian Family Households with Children Correlation Chart
The statistical analysis conducted on geographies consisting of 60,854,309 people shows no correlation between the proportion of Tlingit-Haida and percentage of family households with children in the United States with a correlation coefficient (R) of -0.040 and weighted average of 26.0%. Similarly, the statistical analysis conducted on geographies consisting of 184,562,629 people shows a poor positive correlation between the proportion of Bolivians and percentage of family households with children in the United States with a correlation coefficient (R) of 0.108 and weighted average of 29.5%, a difference of 13.3%.
Family Households with Children Correlation Summary
| Measurement | Tlingit-Haida | Bolivian |
| Minimum | 6.0% | 9.2% |
| Maximum | 36.0% | 59.9% |
| Range | 30.0% | 50.7% |
| Mean | 22.7% | 30.8% |
| Median | 24.4% | 30.3% |
| Interquartile 25% (IQ1) | 17.6% | 27.3% |
| Interquartile 75% (IQ3) | 27.6% | 35.2% |
| Interquartile Range (IQR) | 10.0% | 7.8% |
| Standard Deviation (Sample) | 7.5% | 8.2% |
| Standard Deviation (Population) | 7.4% | 8.2% |
Similar Demographics by Family Households with Children
Demographics Similar to Tlingit-Haida by Family Households with Children
In terms of family households with children, the demographic groups most similar to Tlingit-Haida are British West Indian (26.0%, a difference of 0.010%), Immigrants from France (26.0%, a difference of 0.020%), Immigrants from Greece (26.0%, a difference of 0.030%), Immigrants from Australia (26.0%, a difference of 0.060%), and Chinese (26.0%, a difference of 0.090%).
| Demographics | Rating | Rank | Family Households with Children |
| Cree | 0.0 /100 | #313 | Tragic 26.2% |
| French Canadians | 0.0 /100 | #314 | Tragic 26.1% |
| Immigrants | Norway | 0.0 /100 | #315 | Tragic 26.1% |
| Estonians | 0.0 /100 | #316 | Tragic 26.1% |
| Ottawa | 0.0 /100 | #317 | Tragic 26.1% |
| Iroquois | 0.0 /100 | #318 | Tragic 26.1% |
| Immigrants | France | 0.0 /100 | #319 | Tragic 26.0% |
| Tlingit-Haida | 0.0 /100 | #320 | Tragic 26.0% |
| British West Indians | 0.0 /100 | #321 | Tragic 26.0% |
| Immigrants | Greece | 0.0 /100 | #322 | Tragic 26.0% |
| Immigrants | Australia | 0.0 /100 | #323 | Tragic 26.0% |
| Chinese | 0.0 /100 | #324 | Tragic 26.0% |
| Barbadians | 0.0 /100 | #325 | Tragic 26.0% |
| Immigrants | Ireland | 0.0 /100 | #326 | Tragic 26.0% |
| Immigrants | Barbados | 0.0 /100 | #327 | Tragic 26.0% |
Demographics Similar to Bolivians by Family Households with Children
In terms of family households with children, the demographic groups most similar to Bolivians are Samoan (29.5%, a difference of 0.0%), Yuman (29.5%, a difference of 0.030%), Immigrants from Vietnam (29.5%, a difference of 0.16%), Japanese (29.4%, a difference of 0.18%), and Sri Lankan (29.5%, a difference of 0.19%).
| Demographics | Rating | Rank | Family Households with Children |
| Malaysians | 100.0 /100 | #22 | Exceptional 29.8% |
| Mexican American Indians | 100.0 /100 | #23 | Exceptional 29.7% |
| Guamanians/Chamorros | 100.0 /100 | #24 | Exceptional 29.7% |
| Immigrants | Latin America | 100.0 /100 | #25 | Exceptional 29.7% |
| Sri Lankans | 100.0 /100 | #26 | Exceptional 29.5% |
| Immigrants | Vietnam | 100.0 /100 | #27 | Exceptional 29.5% |
| Samoans | 100.0 /100 | #28 | Exceptional 29.5% |
| Bolivians | 100.0 /100 | #29 | Exceptional 29.5% |
| Yuman | 100.0 /100 | #30 | Exceptional 29.5% |
| Japanese | 100.0 /100 | #31 | Exceptional 29.4% |
| Immigrants | Yemen | 100.0 /100 | #32 | Exceptional 29.4% |
| Venezuelans | 100.0 /100 | #33 | Exceptional 29.4% |
| Immigrants | Bolivia | 100.0 /100 | #34 | Exceptional 29.3% |
| Immigrants | Sierra Leone | 100.0 /100 | #35 | Exceptional 29.3% |
| Immigrants | Venezuela | 100.0 /100 | #36 | Exceptional 29.3% |