Immigrants from Ghana vs Bolivian Disability Age 65 to 74

COMPARE

Immigrants from Ghana
Race
Ancestry
AfghanAfricanAlaska NativeAlaskan AthabascanAlbanianAleutAlsatianAmericanApacheArabArapahoArgentineanArmenianAssyrian/Chaldean/SyriacAustralianAustrianBahamianBangladeshiBarbadianBasqueBelgianBelizeanBermudanBhutaneseBlackfeetBrazilianBritishBritish West IndianBulgarianBurmeseCajunCambodianCanadianCape VerdeanCarpatho RusynCelticCentral AmericanCentral American IndianCherokeeCheyenneChickasawChileanChineseChippewaChoctawColombianColvilleComancheCosta RicanCreeCreekCroatianCrowCubanCypriotCzechCzechoslovakianDanishDelawareDominicanDutchDutch West IndianEastern EuropeanEcuadorianEgyptianEnglishEstonianEthiopianEuropeanFijianFilipinoFinnishFrenchFrench American IndianFrench CanadianGermanGerman RussianGhanaianGreekGuamanian/ChamorroGuatemalanGuyaneseHaitianHmongHonduranHopiHoumaHungarianIcelanderIndian (Asian)IndonesianInupiatIranianIraqiIrishIroquoisIsraeliItalianJamaicanJapaneseJordanianKenyanKiowaKoreanLaotianLatvianLebaneseLiberianLithuanianLumbeeLuxembourgerMacedonianMalaysianMalteseMarshalleseMenomineeMexicanMexican American IndianMongolianMoroccanNative HawaiianNavajoNepaleseNew ZealanderNicaraguanNigerianNorthern EuropeanNorwegianOkinawanOsageOttawaPaiutePakistaniPalestinianPanamanianParaguayanPennsylvania GermanPeruvianPimaPolishPortuguesePotawatomiPuebloPuerto RicanPuget Sound SalishRomanianRussianSalvadoranSamoanScandinavianScotch-IrishScottishSeminoleSenegaleseSerbianShoshoneSierra LeoneanSiouxSlavicSlovakSloveneSomaliSouth AfricanSouth AmericanSouth American IndianSoviet UnionSpaniardSpanishSpanish AmericanSpanish American IndianSri LankanSubsaharan AfricanSudaneseSwedishSwissSyrianTaiwaneseThaiTlingit-HaidaTohono O'OdhamTonganTrinidadian and TobagonianTsimshianTurkishU.S. Virgin IslanderUgandanUkrainianUruguayanUteVenezuelanVietnameseWelshWest IndianYakamaYaquiYugoslavianYumanYup'ikZimbabwean
Immigration
NonimmigrantsImmigrantsAfghanistanAfricaAlbaniaArgentinaArmeniaAsiaAustraliaAustriaBahamasBangladeshBarbadosBelarusBelgiumBelizeBoliviaBosnia and HerzegovinaBrazilBulgariaBurma/MyanmarCabo VerdeCambodiaCameroonCanadaCaribbeanCentral AmericaChileChinaColombiaCongoCosta RicaCroatiaCubaCzechoslovakiaDenmarkDominicaDominican RepublicEastern AfricaEastern AsiaEastern EuropeEcuadorEgyptEl SalvadorEnglandEritreaEthiopiaEuropeFijiFranceGermanyGhanaGreeceGrenadaGuatemalaGuyanaHaitiHondurasHong KongHungaryIndiaIndonesiaIranIraqIrelandIsraelItalyJamaicaJapanJordanKazakhstanKenyaKoreaKuwaitLaosLatin AmericaLatviaLebanonLiberiaLithuaniaMalaysiaMexicoMicronesiaMiddle AfricaMoldovaMoroccoNepalNetherlandsNicaraguaNigeriaNorth AmericaNorth MacedoniaNorthern AfricaNorthern EuropeNorwayOceaniaPakistanPanamaPeruPhilippinesPolandPortugalRomaniaRussiaSaudi ArabiaScotlandSenegalSerbiaSierra LeoneSingaporeSomaliaSouth AfricaSouth AmericaSouth Central AsiaSouth Eastern AsiaSouthern EuropeSpainSri LankaSt. Vincent and the GrenadinesSudanSwedenSwitzerlandSyriaTaiwanThailandTrinidad and TobagoTurkeyUgandaUkraineUruguayUzbekistanVenezuelaVietnamWest IndiesWestern AfricaWestern AsiaWestern EuropeYemenZaireZimbabweAzores
Bolivian
Race
Ancestry
AfghanAfricanAlaska NativeAlaskan AthabascanAlbanianAleutAlsatianAmericanApacheArabArapahoArgentineanArmenianAssyrian/Chaldean/SyriacAustralianAustrianBahamianBangladeshiBarbadianBasqueBelgianBelizeanBermudanBhutaneseBlackfeetBolivianBrazilianBritishBritish West IndianBulgarianBurmeseCajunCambodianCanadianCape VerdeanCarpatho RusynCelticCentral AmericanCentral American IndianCherokeeCheyenneChickasawChileanChineseChippewaChoctawColombianColvilleComancheCosta RicanCreeCreekCroatianCrowCubanCypriotCzechCzechoslovakianDanishDelawareDominicanDutchDutch West IndianEastern EuropeanEcuadorianEgyptianEnglishEstonianEthiopianEuropeanFijianFilipinoFinnishFrenchFrench American IndianFrench CanadianGermanGerman RussianGhanaianGreekGuamanian/ChamorroGuatemalanGuyaneseHaitianHmongHonduranHopiHoumaHungarianIcelanderIndian (Asian)IndonesianInupiatIranianIraqiIrishIroquoisIsraeliItalianJamaicanJapaneseJordanianKenyanKiowaKoreanLaotianLatvianLebaneseLiberianLithuanianLumbeeLuxembourgerMacedonianMalaysianMalteseMarshalleseMenomineeMexicanMexican American IndianMongolianMoroccanNative HawaiianNavajoNepaleseNew ZealanderNicaraguanNigerianNorthern EuropeanNorwegianOkinawanOsageOttawaPaiutePakistaniPalestinianPanamanianParaguayanPennsylvania GermanPeruvianPimaPolishPortuguesePotawatomiPuebloPuerto RicanPuget Sound SalishRomanianRussianSalvadoranSamoanScandinavianScotch-IrishScottishSeminoleSenegaleseSerbianShoshoneSierra LeoneanSiouxSlavicSlovakSloveneSomaliSouth AfricanSouth AmericanSouth American IndianSoviet UnionSpaniardSpanishSpanish AmericanSpanish American IndianSri LankanSubsaharan AfricanSudaneseSwedishSwissSyrianTaiwaneseThaiTlingit-HaidaTohono O'OdhamTonganTrinidadian and TobagonianTsimshianTurkishU.S. Virgin IslanderUgandanUkrainianUruguayanUteVenezuelanVietnameseWelshWest IndianYakamaYaquiYugoslavianYumanYup'ikZimbabwean
Immigration
NonimmigrantsImmigrantsAfghanistanAfricaAlbaniaArgentinaArmeniaAsiaAustraliaAustriaBahamasBangladeshBarbadosBelarusBelgiumBelizeBoliviaBosnia and HerzegovinaBrazilBulgariaBurma/MyanmarCabo VerdeCambodiaCameroonCanadaCaribbeanCentral AmericaChileChinaColombiaCongoCosta RicaCroatiaCubaCzechoslovakiaDenmarkDominicaDominican RepublicEastern AfricaEastern AsiaEastern EuropeEcuadorEgyptEl SalvadorEnglandEritreaEthiopiaEuropeFijiFranceGermanyGreeceGrenadaGuatemalaGuyanaHaitiHondurasHong KongHungaryIndiaIndonesiaIranIraqIrelandIsraelItalyJamaicaJapanJordanKazakhstanKenyaKoreaKuwaitLaosLatin AmericaLatviaLebanonLiberiaLithuaniaMalaysiaMexicoMicronesiaMiddle AfricaMoldovaMoroccoNepalNetherlandsNicaraguaNigeriaNorth AmericaNorth MacedoniaNorthern AfricaNorthern EuropeNorwayOceaniaPakistanPanamaPeruPhilippinesPolandPortugalRomaniaRussiaSaudi ArabiaScotlandSenegalSerbiaSierra LeoneSingaporeSomaliaSouth AfricaSouth AmericaSouth Central AsiaSouth Eastern AsiaSouthern EuropeSpainSri LankaSt. Vincent and the GrenadinesSudanSwedenSwitzerlandSyriaTaiwanThailandTrinidad and TobagoTurkeyUgandaUkraineUruguayUzbekistanVenezuelaVietnamWest IndiesWestern AfricaWestern AsiaWestern EuropeYemenZaireZimbabweAzores
Disability Age 65 to 74
Income
Poverty
Unemployment
Labor Participation
Family Structure
Vehicle Availability
Education Level
Disability

Disability Age 65 to 74 Comparison

Immigrants from Ghana

Bolivians

Tragic
Exceptional
24.5%
DISABILITY AGE 65 TO 74
3.0/ 100
METRIC RATING
238th/ 347
METRIC RANK
21.0%
DISABILITY AGE 65 TO 74
99.9/ 100
METRIC RATING
25th/ 347
METRIC RANK

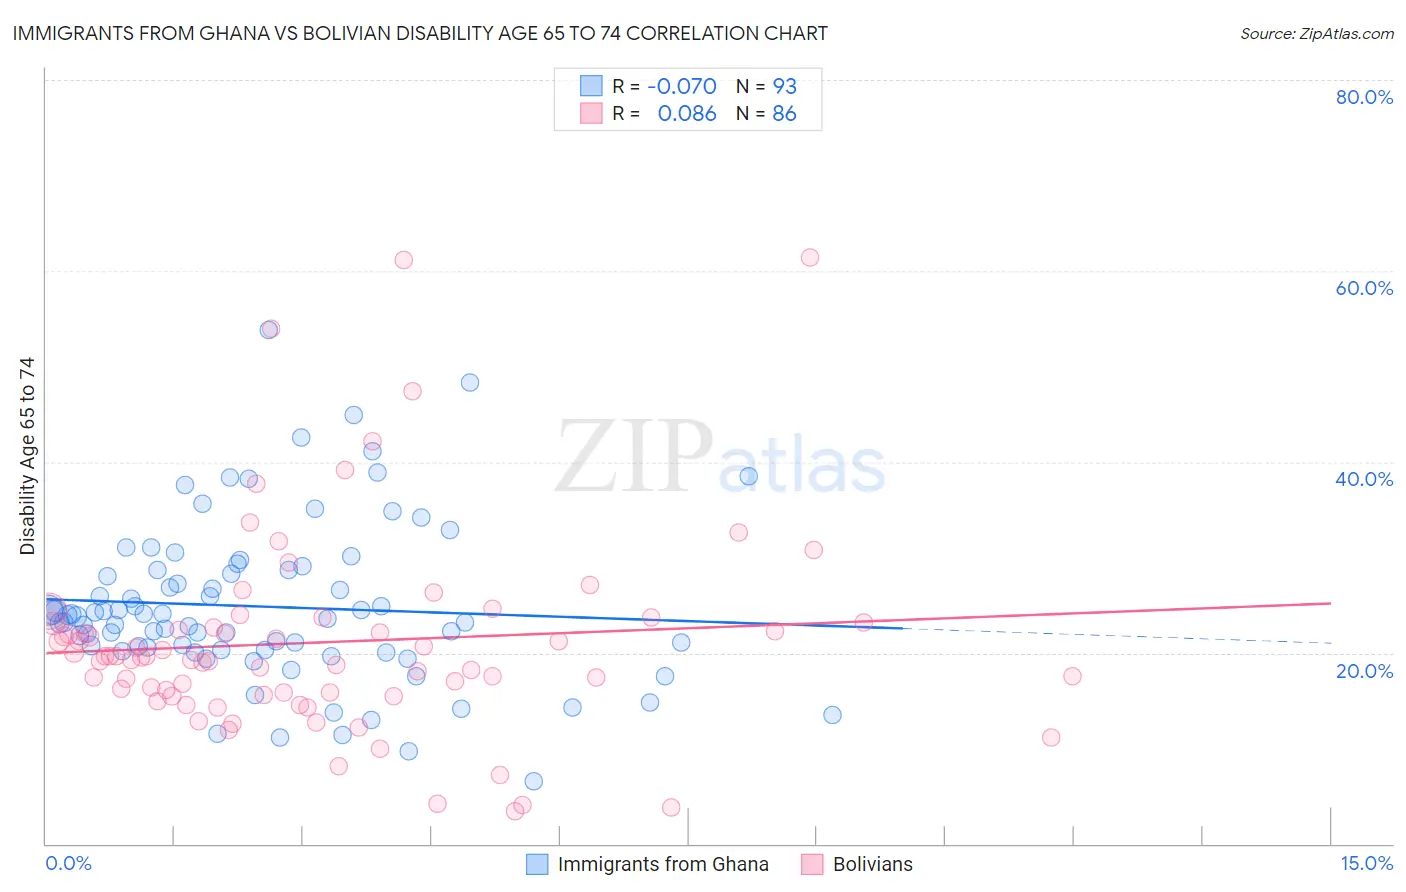
Immigrants from Ghana vs Bolivian Disability Age 65 to 74 Correlation Chart

The statistical analysis conducted on geographies consisting of 199,556,575 people shows a slight negative correlation between the proportion of Immigrants from Ghana and percentage of population with a disability between the ages 65 and 75 in the United States with a correlation coefficient (R) of -0.070 and weighted average of 24.5%. Similarly, the statistical analysis conducted on geographies consisting of 184,504,529 people shows a slight positive correlation between the proportion of Bolivians and percentage of population with a disability between the ages 65 and 75 in the United States with a correlation coefficient (R) of 0.086 and weighted average of 21.0%, a difference of 16.9%.
Immigrants from Ghana vs Bolivian Disability Age 65 to 74

Disability Age 65 to 74 Correlation Summary

MeasurementImmigrants from GhanaBolivian
Minimum6.5%3.5%
Maximum53.8%61.4%
Range47.4%57.9%
Mean24.8%21.1%
Median23.8%19.6%
Interquartile 25% (IQ1)20.3%15.9%
Interquartile 75% (IQ3)28.6%23.1%
Interquartile Range (IQR)8.3%7.2%
Standard Deviation (Sample)8.4%10.6%
Standard Deviation (Population)8.4%10.5%

Similar Demographics by Disability Age 65 to 74

Demographics Similar to Immigrants from Ghana by Disability Age 65 to 74

In terms of disability age 65 to 74, the demographic groups most similar to Immigrants from Ghana are West Indian (24.5%, a difference of 0.17%), Immigrants from Caribbean (24.6%, a difference of 0.22%), German Russian (24.4%, a difference of 0.27%), Scotch-Irish (24.4%, a difference of 0.31%), and Spaniard (24.6%, a difference of 0.31%).
DemographicsRating | RankDisability Age 65 to 74
Immigrants | Thailand
5.2
/100
|
#231
Tragic
24.3%
Immigrants | Zaire
5.0
/100
|
#232
Tragic
24.3%
Bahamians
4.5
/100
|
#233
Tragic
24.4%
Panamanians
4.2
/100
|
#234
Tragic
24.4%
Scotch-Irish
3.8
/100
|
#235
Tragic
24.4%
German Russians
3.7
/100
|
#236
Tragic
24.4%
West Indians
3.4
/100
|
#237
Tragic
24.5%
Immigrants | Ghana
3.0
/100
|
#238
Tragic
24.5%
Immigrants | Caribbean
2.6
/100
|
#239
Tragic
24.6%
Spaniards
2.4
/100
|
#240
Tragic
24.6%
Immigrants | Western Africa
2.3
/100
|
#241
Tragic
24.6%
Immigrants | Senegal
2.2
/100
|
#242
Tragic
24.6%
Spanish
2.2
/100
|
#243
Tragic
24.6%
Armenians
2.0
/100
|
#244
Tragic
24.7%
British West Indians
2.0
/100
|
#245
Tragic
24.7%

Demographics Similar to Bolivians by Disability Age 65 to 74

In terms of disability age 65 to 74, the demographic groups most similar to Bolivians are Immigrants from Australia (21.0%, a difference of 0.020%), Immigrants from Sweden (21.0%, a difference of 0.030%), Soviet Union (21.0%, a difference of 0.040%), Immigrants from Belgium (21.0%, a difference of 0.090%), and Immigrants from Czechoslovakia (21.0%, a difference of 0.13%).
DemographicsRating | RankDisability Age 65 to 74
Eastern Europeans
100.0
/100
|
#18
Exceptional
20.6%
Burmese
100.0
/100
|
#19
Exceptional
20.6%
Okinawans
100.0
/100
|
#20
Exceptional
20.7%
Immigrants | Bolivia
99.9
/100
|
#21
Exceptional
20.8%
Immigrants | Iran
99.9
/100
|
#22
Exceptional
20.9%
Immigrants | Belgium
99.9
/100
|
#23
Exceptional
21.0%
Soviet Union
99.9
/100
|
#24
Exceptional
21.0%
Bolivians
99.9
/100
|
#25
Exceptional
21.0%
Immigrants | Australia
99.9
/100
|
#26
Exceptional
21.0%
Immigrants | Sweden
99.9
/100
|
#27
Exceptional
21.0%
Immigrants | Czechoslovakia
99.9
/100
|
#28
Exceptional
21.0%
Immigrants | Japan
99.9
/100
|
#29
Exceptional
21.0%
Immigrants | Greece
99.9
/100
|
#30
Exceptional
21.0%
Immigrants | Northern Europe
99.9
/100
|
#31
Exceptional
21.0%
Turks
99.9
/100
|
#32
Exceptional
21.0%