Comanche vs Bolivian Disability Age 65 to 74
COMPARE
Comanche
Bolivian
Disability Age 65 to 74
Disability Age 65 to 74 Comparison
Comanche
Bolivians
28.3%
DISABILITY AGE 65 TO 74
0.0/ 100
METRIC RATING
321st/ 347
METRIC RANK
21.0%
DISABILITY AGE 65 TO 74
99.9/ 100
METRIC RATING
25th/ 347
METRIC RANK
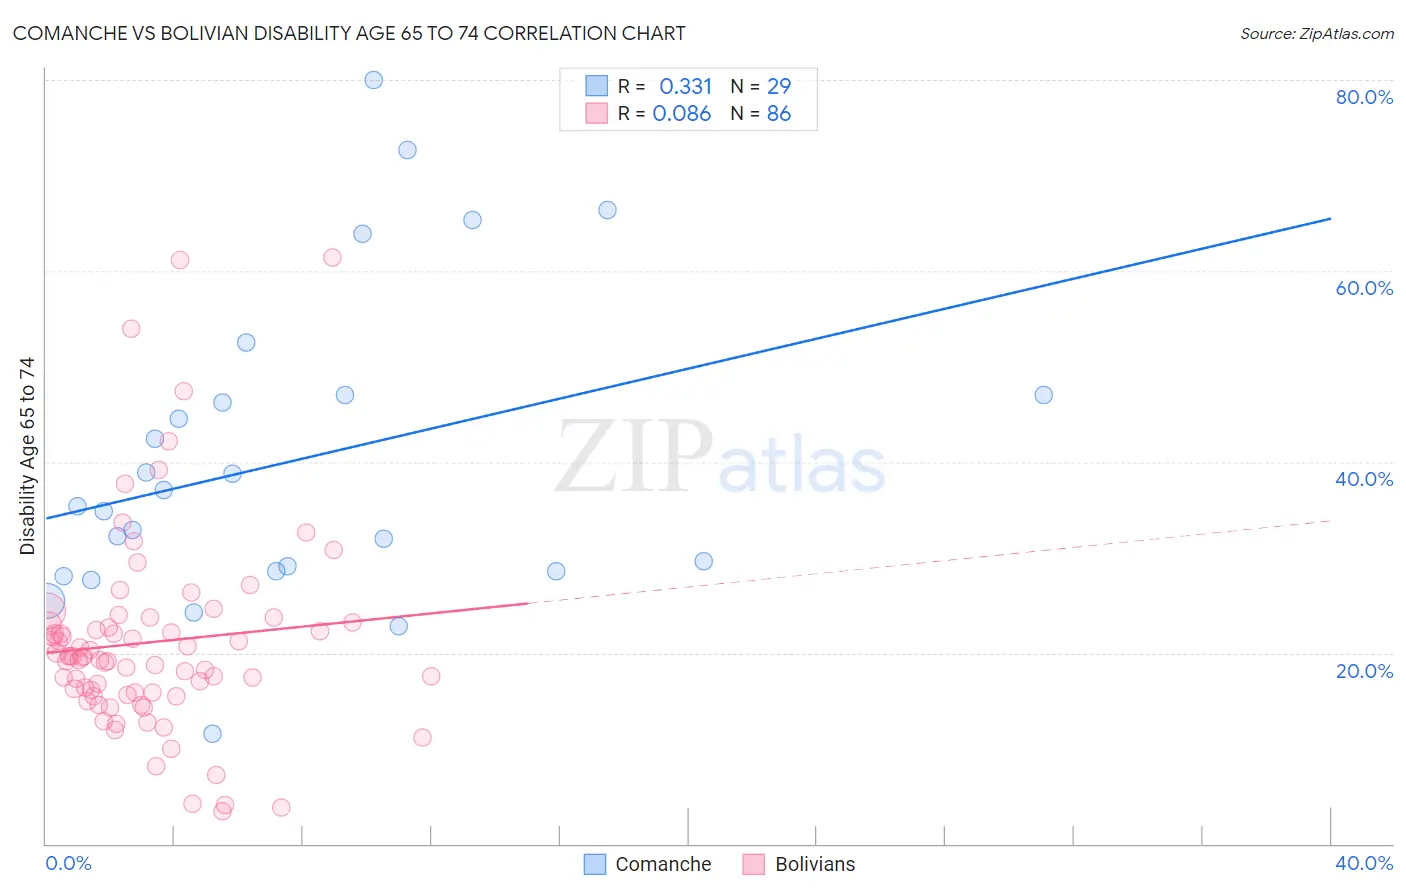
Comanche vs Bolivian Disability Age 65 to 74 Correlation Chart
The statistical analysis conducted on geographies consisting of 109,698,765 people shows a mild positive correlation between the proportion of Comanche and percentage of population with a disability between the ages 65 and 75 in the United States with a correlation coefficient (R) of 0.331 and weighted average of 28.3%. Similarly, the statistical analysis conducted on geographies consisting of 184,504,529 people shows a slight positive correlation between the proportion of Bolivians and percentage of population with a disability between the ages 65 and 75 in the United States with a correlation coefficient (R) of 0.086 and weighted average of 21.0%, a difference of 35.1%.
Disability Age 65 to 74 Correlation Summary
| Measurement | Comanche | Bolivian |
| Minimum | 11.6% | 3.5% |
| Maximum | 80.0% | 61.4% |
| Range | 68.4% | 57.9% |
| Mean | 40.2% | 21.1% |
| Median | 35.3% | 19.6% |
| Interquartile 25% (IQ1) | 28.6% | 15.9% |
| Interquartile 75% (IQ3) | 47.1% | 23.1% |
| Interquartile Range (IQR) | 18.5% | 7.2% |
| Standard Deviation (Sample) | 16.3% | 10.6% |
| Standard Deviation (Population) | 16.1% | 10.5% |
Similar Demographics by Disability Age 65 to 74
Demographics Similar to Comanche by Disability Age 65 to 74
In terms of disability age 65 to 74, the demographic groups most similar to Comanche are Aleut (28.4%, a difference of 0.33%), Cherokee (28.2%, a difference of 0.51%), Arapaho (28.1%, a difference of 0.89%), Nepalese (28.0%, a difference of 1.1%), and Immigrants from Armenia (28.0%, a difference of 1.3%).
| Demographics | Rating | Rank | Disability Age 65 to 74 |
| Chippewa | 0.0 /100 | #314 | Tragic 27.8% |
| Cajuns | 0.0 /100 | #315 | Tragic 27.9% |
| Crow | 0.0 /100 | #316 | Tragic 27.9% |
| Immigrants | Armenia | 0.0 /100 | #317 | Tragic 28.0% |
| Nepalese | 0.0 /100 | #318 | Tragic 28.0% |
| Arapaho | 0.0 /100 | #319 | Tragic 28.1% |
| Cherokee | 0.0 /100 | #320 | Tragic 28.2% |
| Comanche | 0.0 /100 | #321 | Tragic 28.3% |
| Aleuts | 0.0 /100 | #322 | Tragic 28.4% |
| Puerto Ricans | 0.0 /100 | #323 | Tragic 29.1% |
| Seminole | 0.0 /100 | #324 | Tragic 29.4% |
| Dutch West Indians | 0.0 /100 | #325 | Tragic 29.6% |
| Yakama | 0.0 /100 | #326 | Tragic 29.6% |
| Apache | 0.0 /100 | #327 | Tragic 29.7% |
| Hopi | 0.0 /100 | #328 | Tragic 30.0% |
Demographics Similar to Bolivians by Disability Age 65 to 74
In terms of disability age 65 to 74, the demographic groups most similar to Bolivians are Immigrants from Australia (21.0%, a difference of 0.020%), Immigrants from Sweden (21.0%, a difference of 0.030%), Soviet Union (21.0%, a difference of 0.040%), Immigrants from Belgium (21.0%, a difference of 0.090%), and Immigrants from Czechoslovakia (21.0%, a difference of 0.13%).
| Demographics | Rating | Rank | Disability Age 65 to 74 |
| Eastern Europeans | 100.0 /100 | #18 | Exceptional 20.6% |
| Burmese | 100.0 /100 | #19 | Exceptional 20.6% |
| Okinawans | 100.0 /100 | #20 | Exceptional 20.7% |
| Immigrants | Bolivia | 99.9 /100 | #21 | Exceptional 20.8% |
| Immigrants | Iran | 99.9 /100 | #22 | Exceptional 20.9% |
| Immigrants | Belgium | 99.9 /100 | #23 | Exceptional 21.0% |
| Soviet Union | 99.9 /100 | #24 | Exceptional 21.0% |
| Bolivians | 99.9 /100 | #25 | Exceptional 21.0% |
| Immigrants | Australia | 99.9 /100 | #26 | Exceptional 21.0% |
| Immigrants | Sweden | 99.9 /100 | #27 | Exceptional 21.0% |
| Immigrants | Czechoslovakia | 99.9 /100 | #28 | Exceptional 21.0% |
| Immigrants | Japan | 99.9 /100 | #29 | Exceptional 21.0% |
| Immigrants | Greece | 99.9 /100 | #30 | Exceptional 21.0% |
| Immigrants | Northern Europe | 99.9 /100 | #31 | Exceptional 21.0% |
| Turks | 99.9 /100 | #32 | Exceptional 21.0% |