French American Indian vs Bolivian Disability Age 65 to 74
COMPARE
French American Indian
Bolivian
Disability Age 65 to 74
Disability Age 65 to 74 Comparison
French American Indians
Bolivians
25.8%
DISABILITY AGE 65 TO 74
0.1/ 100
METRIC RATING
276th/ 347
METRIC RANK
21.0%
DISABILITY AGE 65 TO 74
99.9/ 100
METRIC RATING
25th/ 347
METRIC RANK
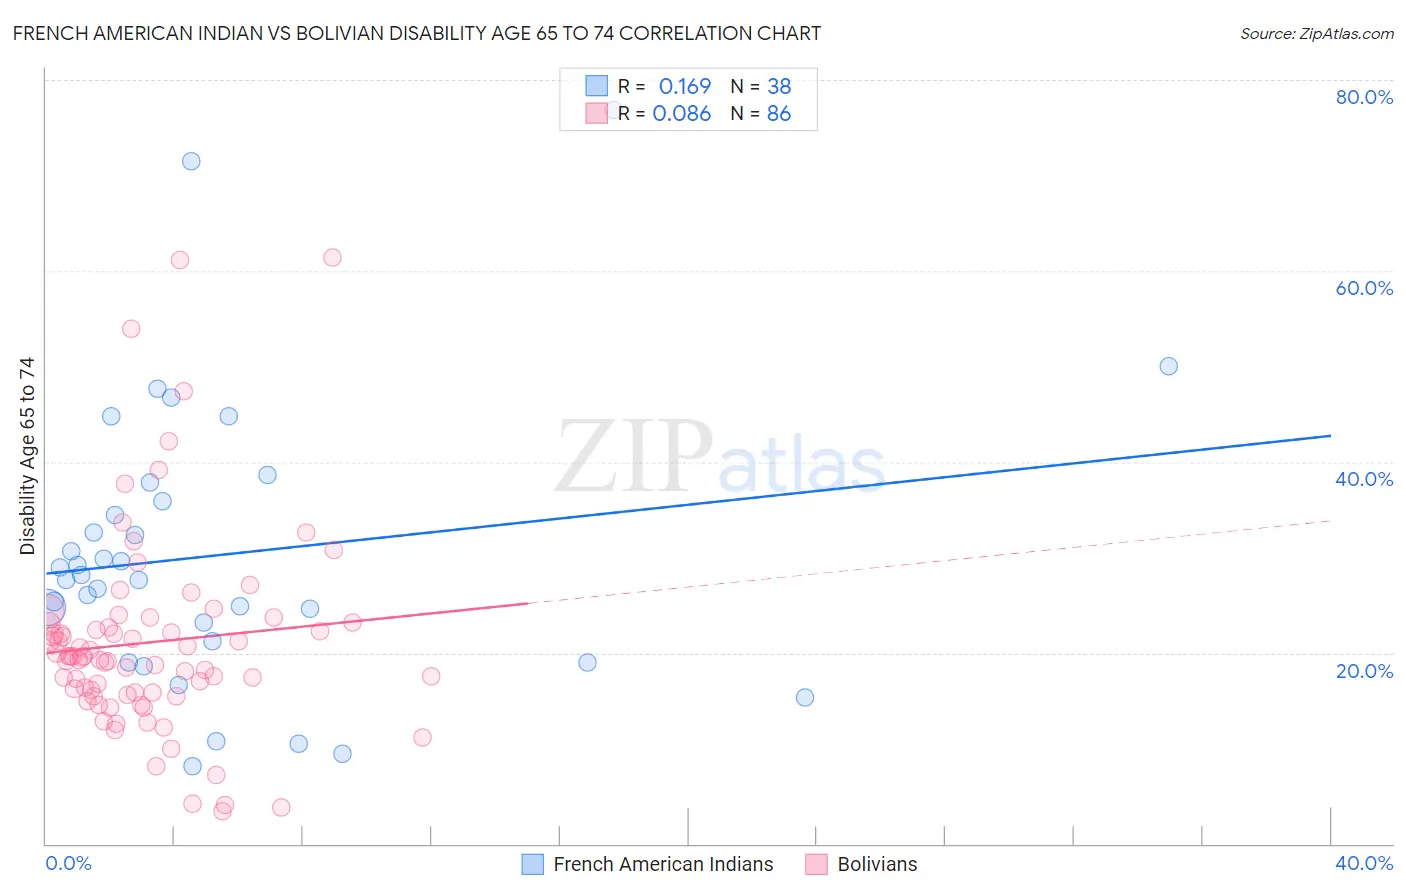
French American Indian vs Bolivian Disability Age 65 to 74 Correlation Chart
The statistical analysis conducted on geographies consisting of 131,943,137 people shows a poor positive correlation between the proportion of French American Indians and percentage of population with a disability between the ages 65 and 75 in the United States with a correlation coefficient (R) of 0.169 and weighted average of 25.8%. Similarly, the statistical analysis conducted on geographies consisting of 184,504,529 people shows a slight positive correlation between the proportion of Bolivians and percentage of population with a disability between the ages 65 and 75 in the United States with a correlation coefficient (R) of 0.086 and weighted average of 21.0%, a difference of 23.1%.
Disability Age 65 to 74 Correlation Summary
| Measurement | French American Indian | Bolivian |
| Minimum | 8.2% | 3.5% |
| Maximum | 76.9% | 61.4% |
| Range | 68.8% | 57.9% |
| Mean | 30.3% | 21.1% |
| Median | 27.9% | 19.6% |
| Interquartile 25% (IQ1) | 21.2% | 15.9% |
| Interquartile 75% (IQ3) | 35.9% | 23.1% |
| Interquartile Range (IQR) | 14.7% | 7.2% |
| Standard Deviation (Sample) | 14.9% | 10.6% |
| Standard Deviation (Population) | 14.7% | 10.5% |
Similar Demographics by Disability Age 65 to 74
Demographics Similar to French American Indians by Disability Age 65 to 74
In terms of disability age 65 to 74, the demographic groups most similar to French American Indians are Honduran (25.8%, a difference of 0.010%), American (25.8%, a difference of 0.020%), Belizean (25.8%, a difference of 0.090%), Immigrants from Belize (25.8%, a difference of 0.11%), and U.S. Virgin Islander (25.9%, a difference of 0.19%).
| Demographics | Rating | Rank | Disability Age 65 to 74 |
| Hmong | 0.1 /100 | #269 | Tragic 25.7% |
| Immigrants | Guatemala | 0.1 /100 | #270 | Tragic 25.7% |
| Immigrants | Liberia | 0.1 /100 | #271 | Tragic 25.7% |
| Immigrants | Dominica | 0.1 /100 | #272 | Tragic 25.7% |
| Japanese | 0.1 /100 | #273 | Tragic 25.7% |
| Americans | 0.1 /100 | #274 | Tragic 25.8% |
| Hondurans | 0.1 /100 | #275 | Tragic 25.8% |
| French American Indians | 0.1 /100 | #276 | Tragic 25.8% |
| Belizeans | 0.1 /100 | #277 | Tragic 25.8% |
| Immigrants | Belize | 0.1 /100 | #278 | Tragic 25.8% |
| U.S. Virgin Islanders | 0.1 /100 | #279 | Tragic 25.9% |
| Cree | 0.1 /100 | #280 | Tragic 25.9% |
| Immigrants | Honduras | 0.1 /100 | #281 | Tragic 25.9% |
| Delaware | 0.1 /100 | #282 | Tragic 25.9% |
| Spanish Americans | 0.0 /100 | #283 | Tragic 25.9% |
Demographics Similar to Bolivians by Disability Age 65 to 74
In terms of disability age 65 to 74, the demographic groups most similar to Bolivians are Immigrants from Australia (21.0%, a difference of 0.020%), Immigrants from Sweden (21.0%, a difference of 0.030%), Soviet Union (21.0%, a difference of 0.040%), Immigrants from Belgium (21.0%, a difference of 0.090%), and Immigrants from Czechoslovakia (21.0%, a difference of 0.13%).
| Demographics | Rating | Rank | Disability Age 65 to 74 |
| Eastern Europeans | 100.0 /100 | #18 | Exceptional 20.6% |
| Burmese | 100.0 /100 | #19 | Exceptional 20.6% |
| Okinawans | 100.0 /100 | #20 | Exceptional 20.7% |
| Immigrants | Bolivia | 99.9 /100 | #21 | Exceptional 20.8% |
| Immigrants | Iran | 99.9 /100 | #22 | Exceptional 20.9% |
| Immigrants | Belgium | 99.9 /100 | #23 | Exceptional 21.0% |
| Soviet Union | 99.9 /100 | #24 | Exceptional 21.0% |
| Bolivians | 99.9 /100 | #25 | Exceptional 21.0% |
| Immigrants | Australia | 99.9 /100 | #26 | Exceptional 21.0% |
| Immigrants | Sweden | 99.9 /100 | #27 | Exceptional 21.0% |
| Immigrants | Czechoslovakia | 99.9 /100 | #28 | Exceptional 21.0% |
| Immigrants | Japan | 99.9 /100 | #29 | Exceptional 21.0% |
| Immigrants | Greece | 99.9 /100 | #30 | Exceptional 21.0% |
| Immigrants | Northern Europe | 99.9 /100 | #31 | Exceptional 21.0% |
| Turks | 99.9 /100 | #32 | Exceptional 21.0% |