Tlingit-Haida vs Belizean Unemployment Among Ages 25 to 29 years
COMPARE
Tlingit-Haida
Belizean
Unemployment Among Ages 25 to 29 years
Unemployment Among Ages 25 to 29 years Comparison
Tlingit-Haida
Belizeans
8.7%
UNEMPLOYMENT AMONG AGES 25 TO 29 YEARS
0.0/ 100
METRIC RATING
322nd/ 347
METRIC RANK
7.7%
UNEMPLOYMENT AMONG AGES 25 TO 29 YEARS
0.0/ 100
METRIC RATING
289th/ 347
METRIC RANK
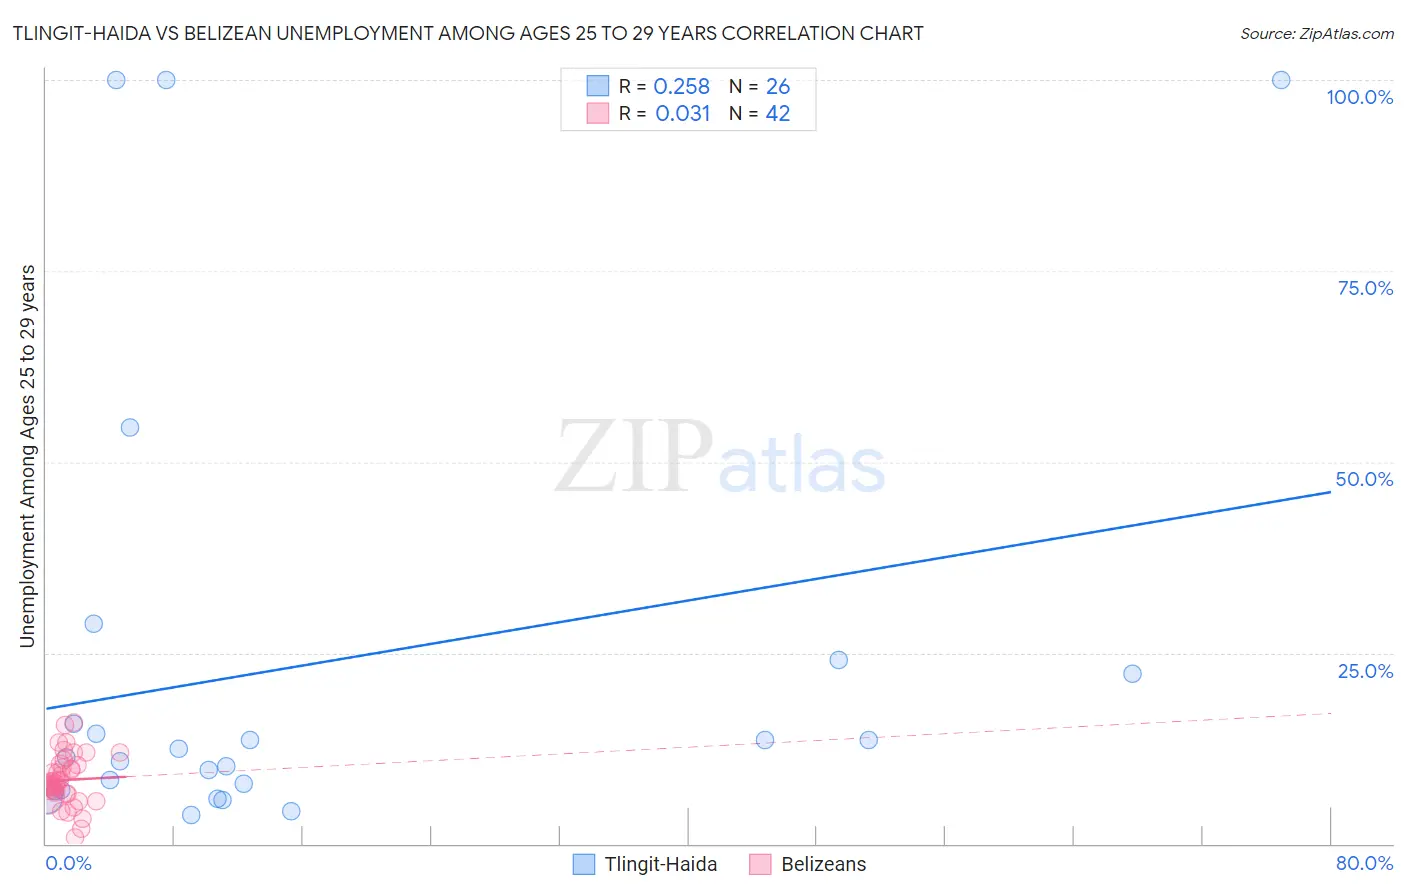
Tlingit-Haida vs Belizean Unemployment Among Ages 25 to 29 years Correlation Chart
The statistical analysis conducted on geographies consisting of 59,716,072 people shows a weak positive correlation between the proportion of Tlingit-Haida and unemployment rate among population between the ages 25 and 29 in the United States with a correlation coefficient (R) of 0.258 and weighted average of 8.7%. Similarly, the statistical analysis conducted on geographies consisting of 142,349,315 people shows no correlation between the proportion of Belizeans and unemployment rate among population between the ages 25 and 29 in the United States with a correlation coefficient (R) of 0.031 and weighted average of 7.7%, a difference of 12.8%.
Unemployment Among Ages 25 to 29 years Correlation Summary
| Measurement | Tlingit-Haida | Belizean |
| Minimum | 3.8% | 0.80% |
| Maximum | 100.0% | 15.8% |
| Range | 96.2% | 15.0% |
| Mean | 23.5% | 8.4% |
| Median | 11.9% | 7.9% |
| Interquartile 25% (IQ1) | 7.0% | 6.6% |
| Interquartile 75% (IQ3) | 22.2% | 10.3% |
| Interquartile Range (IQR) | 15.2% | 3.7% |
| Standard Deviation (Sample) | 30.0% | 3.3% |
| Standard Deviation (Population) | 29.4% | 3.2% |
Similar Demographics by Unemployment Among Ages 25 to 29 years
Demographics Similar to Tlingit-Haida by Unemployment Among Ages 25 to 29 years
In terms of unemployment among ages 25 to 29 years, the demographic groups most similar to Tlingit-Haida are Dominican (8.7%, a difference of 0.10%), Houma (8.7%, a difference of 0.45%), Immigrants from Dominican Republic (8.6%, a difference of 0.78%), Yakama (8.8%, a difference of 0.96%), and Black/African American (8.6%, a difference of 1.4%).
| Demographics | Rating | Rank | Unemployment Among Ages 25 to 29 years |
| British West Indians | 0.0 /100 | #315 | Tragic 8.4% |
| Immigrants | Grenada | 0.0 /100 | #316 | Tragic 8.4% |
| Immigrants | Guyana | 0.0 /100 | #317 | Tragic 8.5% |
| Guyanese | 0.0 /100 | #318 | Tragic 8.5% |
| Immigrants | Armenia | 0.0 /100 | #319 | Tragic 8.5% |
| Blacks/African Americans | 0.0 /100 | #320 | Tragic 8.6% |
| Immigrants | Dominican Republic | 0.0 /100 | #321 | Tragic 8.6% |
| Tlingit-Haida | 0.0 /100 | #322 | Tragic 8.7% |
| Dominicans | 0.0 /100 | #323 | Tragic 8.7% |
| Houma | 0.0 /100 | #324 | Tragic 8.7% |
| Yakama | 0.0 /100 | #325 | Tragic 8.8% |
| Shoshone | 0.0 /100 | #326 | Tragic 9.2% |
| Colville | 0.0 /100 | #327 | Tragic 9.2% |
| Apache | 0.0 /100 | #328 | Tragic 9.5% |
| Aleuts | 0.0 /100 | #329 | Tragic 9.7% |
Demographics Similar to Belizeans by Unemployment Among Ages 25 to 29 years
In terms of unemployment among ages 25 to 29 years, the demographic groups most similar to Belizeans are Armenian (7.7%, a difference of 0.10%), Hispanic or Latino (7.7%, a difference of 0.49%), African (7.6%, a difference of 0.71%), Immigrants from Mexico (7.6%, a difference of 0.77%), and Chippewa (7.8%, a difference of 0.90%).
| Demographics | Rating | Rank | Unemployment Among Ages 25 to 29 years |
| Immigrants | Senegal | 0.0 /100 | #282 | Tragic 7.6% |
| Creek | 0.0 /100 | #283 | Tragic 7.6% |
| Cherokee | 0.0 /100 | #284 | Tragic 7.6% |
| Senegalese | 0.0 /100 | #285 | Tragic 7.6% |
| Vietnamese | 0.0 /100 | #286 | Tragic 7.6% |
| Immigrants | Mexico | 0.0 /100 | #287 | Tragic 7.6% |
| Africans | 0.0 /100 | #288 | Tragic 7.6% |
| Belizeans | 0.0 /100 | #289 | Tragic 7.7% |
| Armenians | 0.0 /100 | #290 | Tragic 7.7% |
| Hispanics or Latinos | 0.0 /100 | #291 | Tragic 7.7% |
| Chippewa | 0.0 /100 | #292 | Tragic 7.8% |
| Immigrants | Belize | 0.0 /100 | #293 | Tragic 7.8% |
| Trinidadians and Tobagonians | 0.0 /100 | #294 | Tragic 7.8% |
| Comanche | 0.0 /100 | #295 | Tragic 7.8% |
| Immigrants | West Indies | 0.0 /100 | #296 | Tragic 7.8% |