Filipino vs Belizean Female Disability
COMPARE
Filipino
Belizean
Female Disability
Female Disability Comparison
Filipinos
Belizeans
10.1%
FEMALE DISABILITY
100.0/ 100
METRIC RATING
2nd/ 347
METRIC RANK
12.5%
FEMALE DISABILITY
9.3/ 100
METRIC RATING
224th/ 347
METRIC RANK
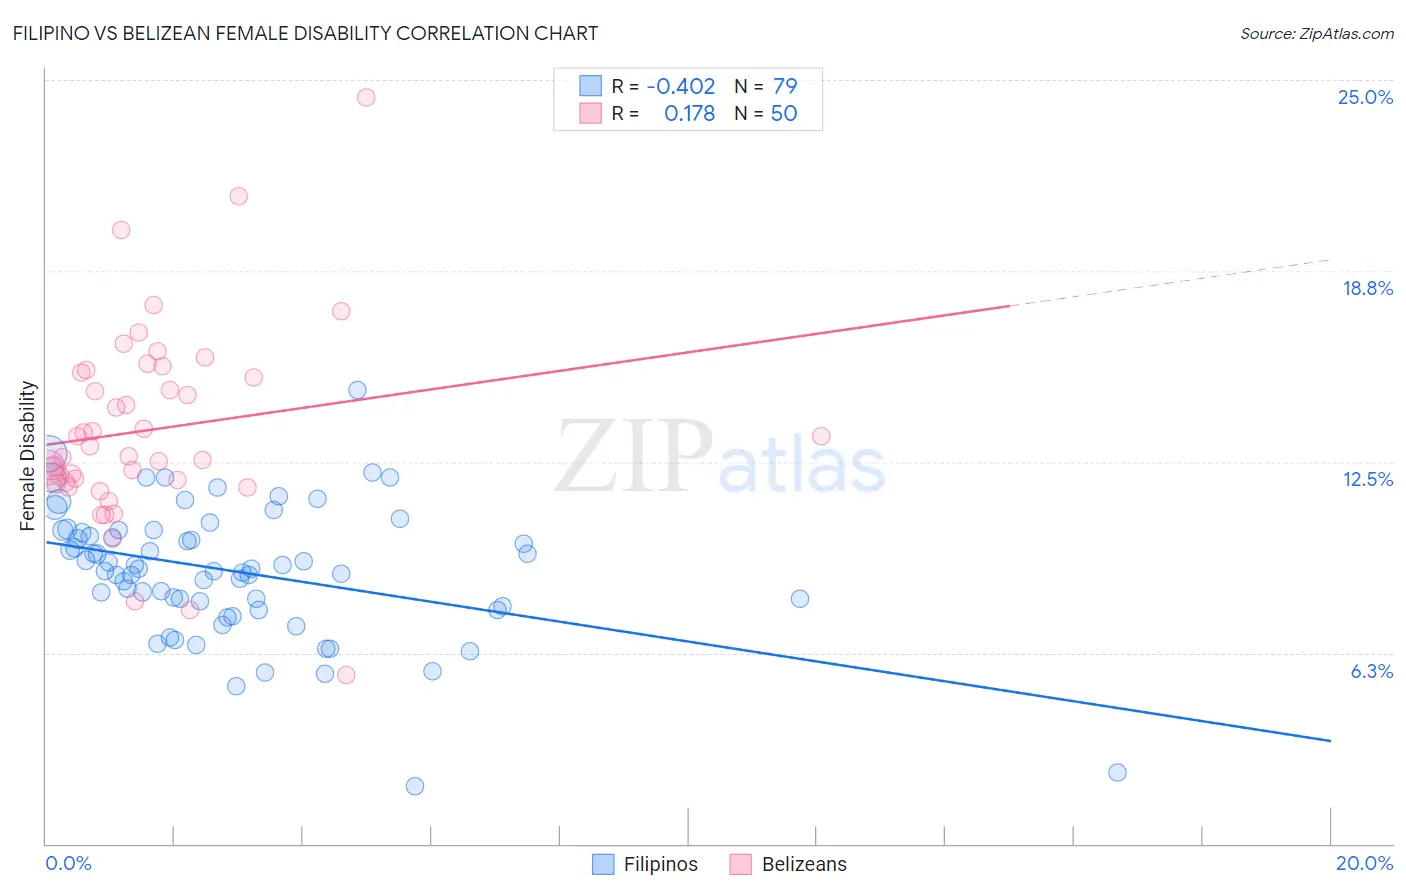
Filipino vs Belizean Female Disability Correlation Chart
The statistical analysis conducted on geographies consisting of 254,340,096 people shows a moderate negative correlation between the proportion of Filipinos and percentage of females with a disability in the United States with a correlation coefficient (R) of -0.402 and weighted average of 10.1%. Similarly, the statistical analysis conducted on geographies consisting of 144,186,476 people shows a poor positive correlation between the proportion of Belizeans and percentage of females with a disability in the United States with a correlation coefficient (R) of 0.178 and weighted average of 12.5%, a difference of 23.8%.
Female Disability Correlation Summary
| Measurement | Filipino | Belizean |
| Minimum | 1.9% | 5.5% |
| Maximum | 14.8% | 24.4% |
| Range | 13.0% | 18.9% |
| Mean | 8.9% | 13.5% |
| Median | 9.0% | 12.8% |
| Interquartile 25% (IQ1) | 7.8% | 11.8% |
| Interquartile 75% (IQ3) | 10.3% | 15.4% |
| Interquartile Range (IQR) | 2.5% | 3.6% |
| Standard Deviation (Sample) | 2.2% | 3.2% |
| Standard Deviation (Population) | 2.1% | 3.2% |
Similar Demographics by Female Disability
Demographics Similar to Filipinos by Female Disability
In terms of female disability, the demographic groups most similar to Filipinos are Immigrants from Taiwan (10.1%, a difference of 0.23%), Immigrants from India (10.0%, a difference of 0.93%), Thai (10.2%, a difference of 1.1%), Immigrants from Bolivia (10.3%, a difference of 1.9%), and Bolivian (10.4%, a difference of 2.9%).
| Demographics | Rating | Rank | Female Disability |
| Immigrants | India | 100.0 /100 | #1 | Exceptional 10.0% |
| Filipinos | 100.0 /100 | #2 | Exceptional 10.1% |
| Immigrants | Taiwan | 100.0 /100 | #3 | Exceptional 10.1% |
| Thais | 100.0 /100 | #4 | Exceptional 10.2% |
| Immigrants | Bolivia | 100.0 /100 | #5 | Exceptional 10.3% |
| Bolivians | 100.0 /100 | #6 | Exceptional 10.4% |
| Immigrants | Singapore | 100.0 /100 | #7 | Exceptional 10.4% |
| Immigrants | South Central Asia | 100.0 /100 | #8 | Exceptional 10.5% |
| Iranians | 100.0 /100 | #9 | Exceptional 10.6% |
| Immigrants | Hong Kong | 100.0 /100 | #10 | Exceptional 10.6% |
| Immigrants | Korea | 100.0 /100 | #11 | Exceptional 10.6% |
| Immigrants | Israel | 100.0 /100 | #12 | Exceptional 10.7% |
| Immigrants | Eastern Asia | 100.0 /100 | #13 | Exceptional 10.7% |
| Immigrants | China | 100.0 /100 | #14 | Exceptional 10.7% |
| Burmese | 100.0 /100 | #15 | Exceptional 10.7% |
Demographics Similar to Belizeans by Female Disability
In terms of female disability, the demographic groups most similar to Belizeans are Guamanian/Chamorro (12.5%, a difference of 0.020%), Polish (12.5%, a difference of 0.10%), Italian (12.4%, a difference of 0.14%), Hispanic or Latino (12.5%, a difference of 0.15%), and Native Hawaiian (12.4%, a difference of 0.16%).
| Demographics | Rating | Rank | Female Disability |
| British | 12.7 /100 | #217 | Poor 12.4% |
| Immigrants | Bahamas | 12.5 /100 | #218 | Poor 12.4% |
| Europeans | 12.1 /100 | #219 | Poor 12.4% |
| Bahamians | 11.1 /100 | #220 | Poor 12.4% |
| Native Hawaiians | 10.8 /100 | #221 | Poor 12.4% |
| Italians | 10.7 /100 | #222 | Poor 12.4% |
| Guamanians/Chamorros | 9.5 /100 | #223 | Tragic 12.5% |
| Belizeans | 9.3 /100 | #224 | Tragic 12.5% |
| Poles | 8.4 /100 | #225 | Tragic 12.5% |
| Hispanics or Latinos | 8.0 /100 | #226 | Tragic 12.5% |
| Assyrians/Chaldeans/Syriacs | 8.0 /100 | #227 | Tragic 12.5% |
| Immigrants | Cambodia | 7.8 /100 | #228 | Tragic 12.5% |
| Hungarians | 7.2 /100 | #229 | Tragic 12.5% |
| Immigrants | Belize | 7.0 /100 | #230 | Tragic 12.5% |
| Belgians | 6.5 /100 | #231 | Tragic 12.5% |