Syrian vs Immigrants from Latvia Child Poverty Under the Age of 16
COMPARE
Syrian
Immigrants from Latvia
Child Poverty Under the Age of 16
Child Poverty Under the Age of 16 Comparison
Syrians
Immigrants from Latvia
15.6%
CHILD POVERTY UNDER THE AGE OF 16
76.1/ 100
METRIC RATING
155th/ 347
METRIC RANK
14.5%
CHILD POVERTY UNDER THE AGE OF 16
97.1/ 100
METRIC RATING
84th/ 347
METRIC RANK
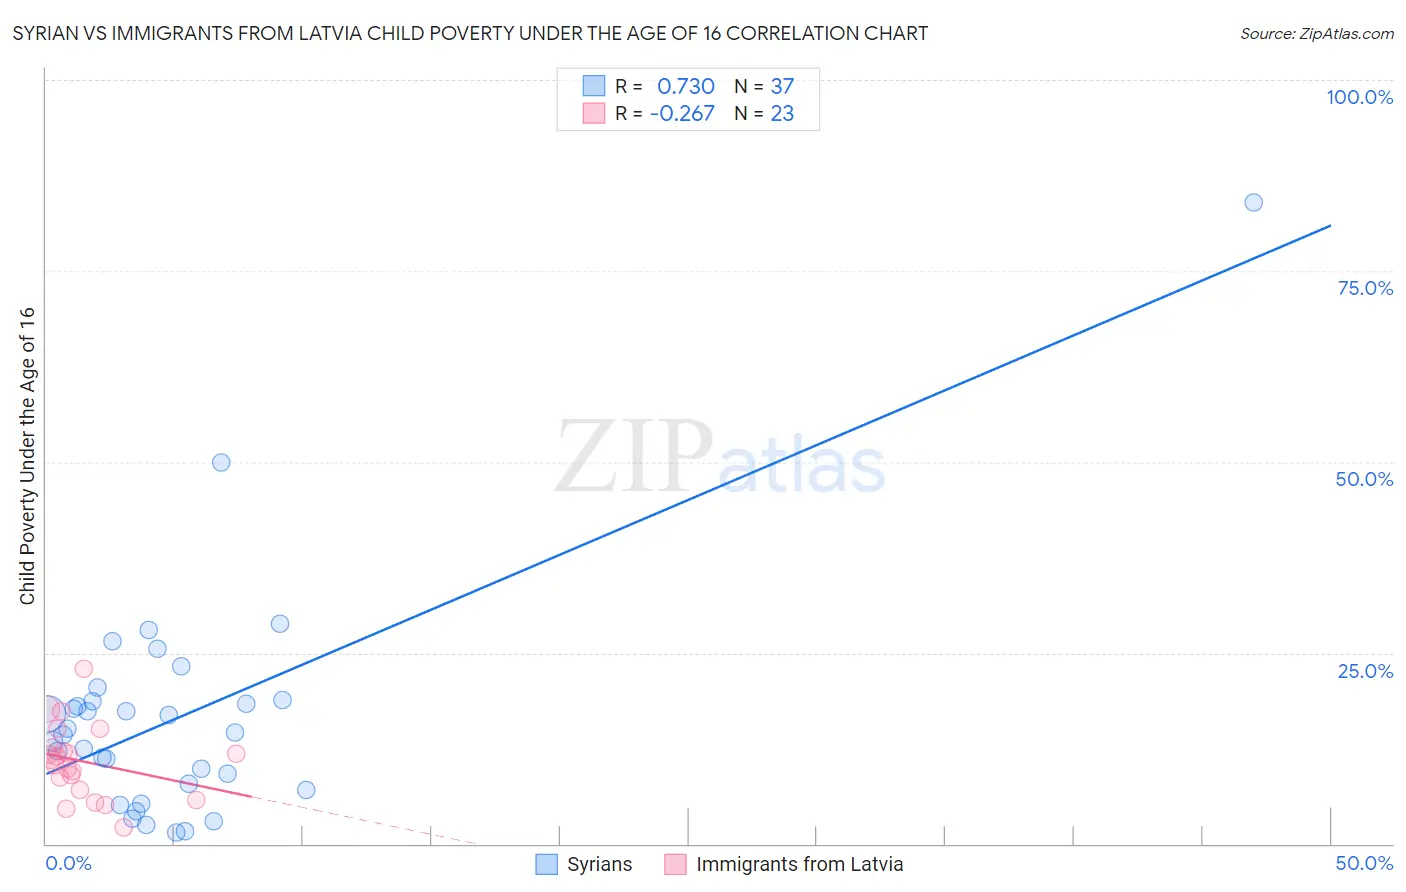
Syrian vs Immigrants from Latvia Child Poverty Under the Age of 16 Correlation Chart
The statistical analysis conducted on geographies consisting of 264,232,814 people shows a strong positive correlation between the proportion of Syrians and poverty level among children under the age of 16 in the United States with a correlation coefficient (R) of 0.730 and weighted average of 15.6%. Similarly, the statistical analysis conducted on geographies consisting of 113,191,371 people shows a weak negative correlation between the proportion of Immigrants from Latvia and poverty level among children under the age of 16 in the United States with a correlation coefficient (R) of -0.267 and weighted average of 14.5%, a difference of 8.0%.
Child Poverty Under the Age of 16 Correlation Summary
| Measurement | Syrian | Immigrants from Latvia |
| Minimum | 1.5% | 2.2% |
| Maximum | 84.0% | 22.9% |
| Range | 82.5% | 20.7% |
| Mean | 16.5% | 10.8% |
| Median | 14.5% | 11.1% |
| Interquartile 25% (IQ1) | 7.5% | 7.0% |
| Interquartile 75% (IQ3) | 18.7% | 12.7% |
| Interquartile Range (IQR) | 11.2% | 5.7% |
| Standard Deviation (Sample) | 14.9% | 4.8% |
| Standard Deviation (Population) | 14.7% | 4.7% |
Similar Demographics by Child Poverty Under the Age of 16
Demographics Similar to Syrians by Child Poverty Under the Age of 16
In terms of child poverty under the age of 16, the demographic groups most similar to Syrians are Immigrants from Venezuela (15.7%, a difference of 0.20%), Samoan (15.6%, a difference of 0.21%), Venezuelan (15.6%, a difference of 0.24%), French Canadian (15.6%, a difference of 0.38%), and Immigrants from Jordan (15.6%, a difference of 0.42%).
| Demographics | Rating | Rank | Child Poverty Under the Age of 16 |
| Puget Sound Salish | 80.3 /100 | #148 | Excellent 15.5% |
| Israelis | 80.1 /100 | #149 | Excellent 15.5% |
| Immigrants | Jordan | 78.5 /100 | #150 | Good 15.6% |
| French | 78.5 /100 | #151 | Good 15.6% |
| French Canadians | 78.2 /100 | #152 | Good 15.6% |
| Venezuelans | 77.4 /100 | #153 | Good 15.6% |
| Samoans | 77.3 /100 | #154 | Good 15.6% |
| Syrians | 76.1 /100 | #155 | Good 15.6% |
| Immigrants | Venezuela | 74.9 /100 | #156 | Good 15.7% |
| Immigrants | Nepal | 72.9 /100 | #157 | Good 15.7% |
| Immigrants | Chile | 72.8 /100 | #158 | Good 15.7% |
| Immigrants | Fiji | 71.1 /100 | #159 | Good 15.8% |
| Immigrants | Albania | 70.7 /100 | #160 | Good 15.8% |
| Immigrants | Northern Africa | 68.1 /100 | #161 | Good 15.8% |
| Colombians | 67.6 /100 | #162 | Good 15.8% |
Demographics Similar to Immigrants from Latvia by Child Poverty Under the Age of 16
In terms of child poverty under the age of 16, the demographic groups most similar to Immigrants from Latvia are Egyptian (14.5%, a difference of 0.020%), Soviet Union (14.5%, a difference of 0.020%), Immigrants from Canada (14.5%, a difference of 0.050%), Finnish (14.5%, a difference of 0.080%), and Immigrants from Argentina (14.5%, a difference of 0.10%).
| Demographics | Rating | Rank | Child Poverty Under the Age of 16 |
| Australians | 97.5 /100 | #77 | Exceptional 14.4% |
| Immigrants | Russia | 97.3 /100 | #78 | Exceptional 14.5% |
| Swiss | 97.3 /100 | #79 | Exceptional 14.5% |
| Immigrants | North Macedonia | 97.2 /100 | #80 | Exceptional 14.5% |
| Finns | 97.2 /100 | #81 | Exceptional 14.5% |
| Immigrants | Canada | 97.2 /100 | #82 | Exceptional 14.5% |
| Egyptians | 97.2 /100 | #83 | Exceptional 14.5% |
| Immigrants | Latvia | 97.1 /100 | #84 | Exceptional 14.5% |
| Soviet Union | 97.1 /100 | #85 | Exceptional 14.5% |
| Immigrants | Argentina | 97.1 /100 | #86 | Exceptional 14.5% |
| Taiwanese | 97.1 /100 | #87 | Exceptional 14.5% |
| Northern Europeans | 97.0 /100 | #88 | Exceptional 14.5% |
| Germans | 96.9 /100 | #89 | Exceptional 14.5% |
| Austrians | 96.9 /100 | #90 | Exceptional 14.5% |
| Immigrants | North America | 96.7 /100 | #91 | Exceptional 14.6% |