Syrian vs German Male Disability
COMPARE
Syrian
German
Male Disability
Male Disability Comparison
Syrians
Germans
11.2%
MALE DISABILITY
46.6/ 100
METRIC RATING
176th/ 347
METRIC RANK
12.7%
MALE DISABILITY
0.0/ 100
METRIC RATING
283rd/ 347
METRIC RANK
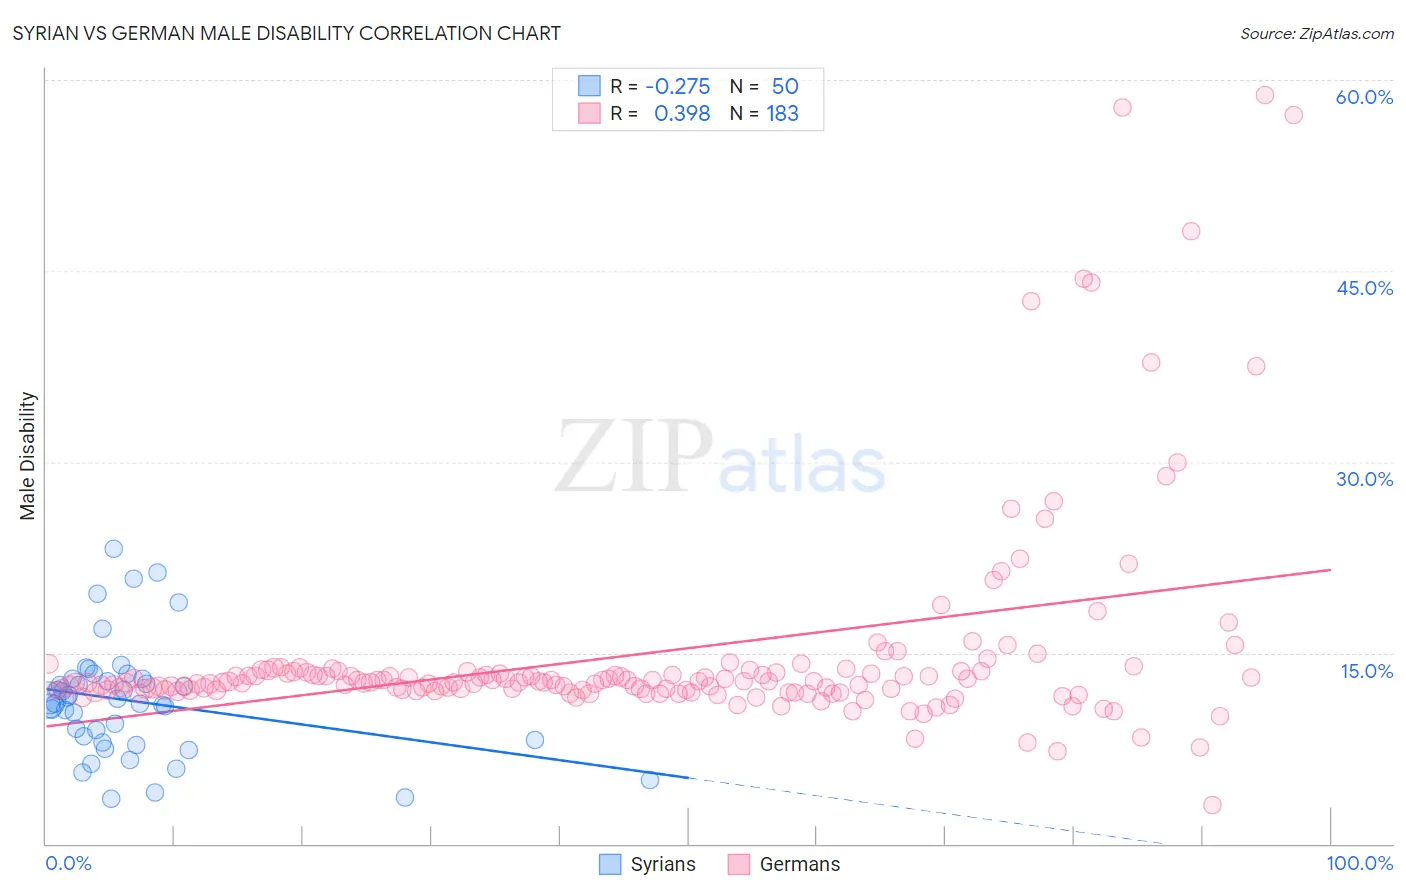
Syrian vs German Male Disability Correlation Chart
The statistical analysis conducted on geographies consisting of 266,314,155 people shows a weak negative correlation between the proportion of Syrians and percentage of males with a disability in the United States with a correlation coefficient (R) of -0.275 and weighted average of 11.2%. Similarly, the statistical analysis conducted on geographies consisting of 580,769,413 people shows a mild positive correlation between the proportion of Germans and percentage of males with a disability in the United States with a correlation coefficient (R) of 0.398 and weighted average of 12.7%, a difference of 13.1%.
Male Disability Correlation Summary
| Measurement | Syrian | German |
| Minimum | 3.5% | 3.0% |
| Maximum | 23.2% | 58.8% |
| Range | 19.7% | 55.8% |
| Mean | 11.2% | 14.9% |
| Median | 11.2% | 12.7% |
| Interquartile 25% (IQ1) | 8.1% | 12.1% |
| Interquartile 75% (IQ3) | 12.9% | 13.5% |
| Interquartile Range (IQR) | 4.8% | 1.4% |
| Standard Deviation (Sample) | 4.4% | 8.3% |
| Standard Deviation (Population) | 4.4% | 8.3% |
Similar Demographics by Male Disability
Demographics Similar to Syrians by Male Disability
In terms of male disability, the demographic groups most similar to Syrians are Immigrants from Honduras (11.2%, a difference of 0.12%), Immigrants from Norway (11.3%, a difference of 0.13%), Maltese (11.2%, a difference of 0.19%), Immigrants from Burma/Myanmar (11.2%, a difference of 0.21%), and Romanian (11.2%, a difference of 0.23%).
| Demographics | Rating | Rank | Male Disability |
| Barbadians | 53.4 /100 | #169 | Average 11.2% |
| New Zealanders | 52.9 /100 | #170 | Average 11.2% |
| Haitians | 52.5 /100 | #171 | Average 11.2% |
| Romanians | 50.7 /100 | #172 | Average 11.2% |
| Immigrants | Burma/Myanmar | 50.4 /100 | #173 | Average 11.2% |
| Maltese | 50.0 /100 | #174 | Average 11.2% |
| Immigrants | Honduras | 48.7 /100 | #175 | Average 11.2% |
| Syrians | 46.6 /100 | #176 | Average 11.2% |
| Immigrants | Norway | 44.2 /100 | #177 | Average 11.3% |
| Australians | 42.2 /100 | #178 | Average 11.3% |
| Immigrants | Caribbean | 41.4 /100 | #179 | Average 11.3% |
| Hondurans | 41.1 /100 | #180 | Average 11.3% |
| Immigrants | Senegal | 34.4 /100 | #181 | Fair 11.3% |
| Immigrants | Belize | 33.7 /100 | #182 | Fair 11.3% |
| Immigrants | Central America | 32.9 /100 | #183 | Fair 11.3% |
Demographics Similar to Germans by Male Disability
In terms of male disability, the demographic groups most similar to Germans are Irish (12.7%, a difference of 0.010%), Sioux (12.7%, a difference of 0.070%), Dutch (12.7%, a difference of 0.12%), Slovak (12.7%, a difference of 0.17%), and Spanish (12.7%, a difference of 0.27%).
| Demographics | Rating | Rank | Male Disability |
| Africans | 0.0 /100 | #276 | Tragic 12.6% |
| Finns | 0.0 /100 | #277 | Tragic 12.6% |
| Central American Indians | 0.0 /100 | #278 | Tragic 12.7% |
| Slovaks | 0.0 /100 | #279 | Tragic 12.7% |
| Dutch | 0.0 /100 | #280 | Tragic 12.7% |
| Sioux | 0.0 /100 | #281 | Tragic 12.7% |
| Irish | 0.0 /100 | #282 | Tragic 12.7% |
| Germans | 0.0 /100 | #283 | Tragic 12.7% |
| Spanish | 0.0 /100 | #284 | Tragic 12.7% |
| Welsh | 0.0 /100 | #285 | Tragic 12.7% |
| Scottish | 0.0 /100 | #286 | Tragic 12.8% |
| Cape Verdeans | 0.0 /100 | #287 | Tragic 12.8% |
| Yup'ik | 0.0 /100 | #288 | Tragic 12.8% |
| Immigrants | Cabo Verde | 0.0 /100 | #289 | Tragic 12.8% |
| Pima | 0.0 /100 | #290 | Tragic 12.8% |