Syrian vs German Ambulatory Disability
COMPARE
Syrian
German
Ambulatory Disability
Ambulatory Disability Comparison
Syrians
Germans
6.0%
AMBULATORY DISABILITY
75.5/ 100
METRIC RATING
153rd/ 347
METRIC RANK
6.5%
AMBULATORY DISABILITY
1.5/ 100
METRIC RATING
243rd/ 347
METRIC RANK
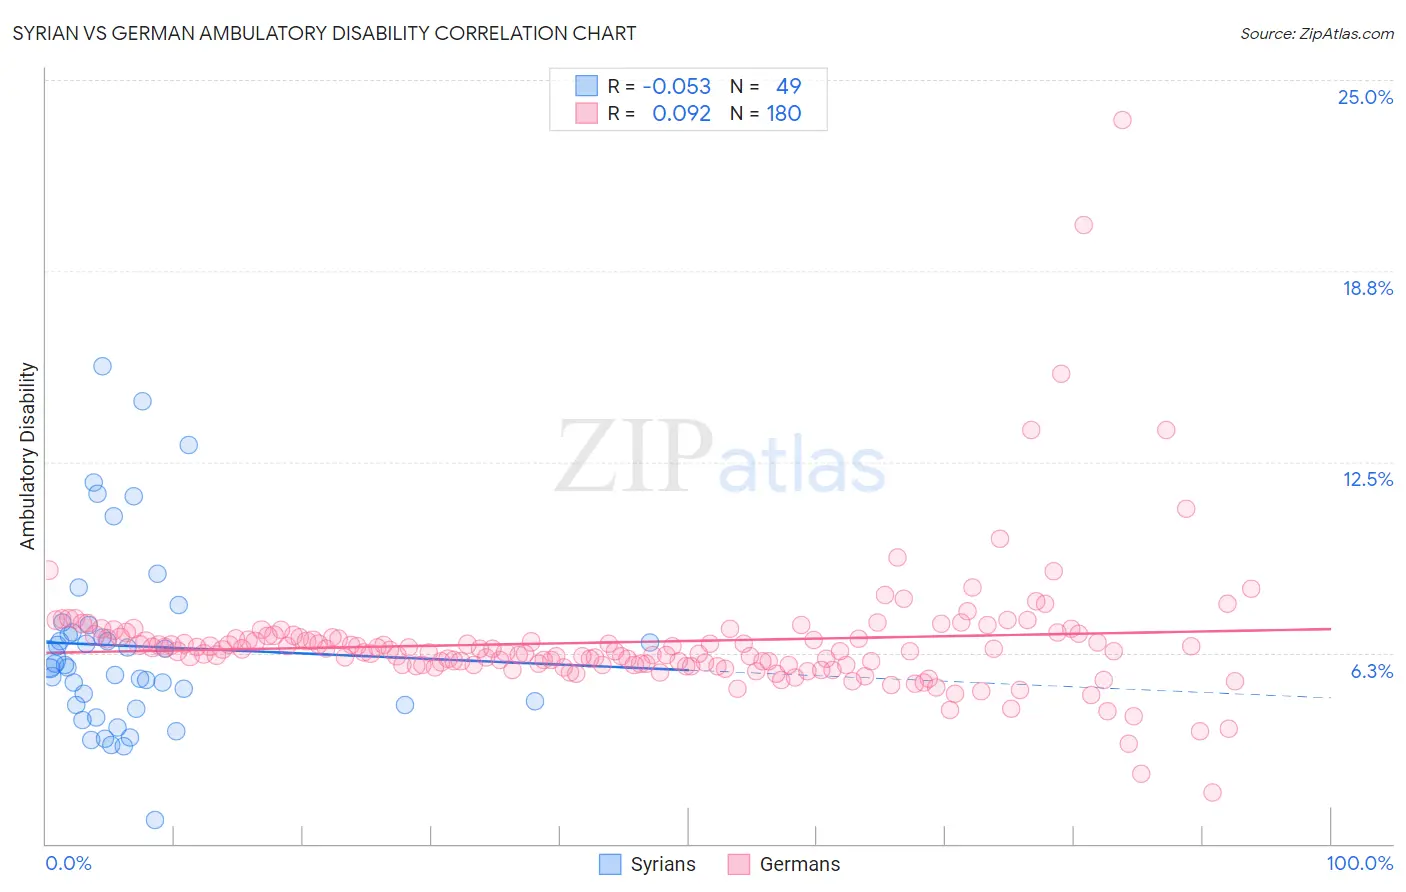
Syrian vs German Ambulatory Disability Correlation Chart
The statistical analysis conducted on geographies consisting of 266,278,347 people shows a slight negative correlation between the proportion of Syrians and percentage of population with ambulatory disability in the United States with a correlation coefficient (R) of -0.053 and weighted average of 6.0%. Similarly, the statistical analysis conducted on geographies consisting of 580,433,029 people shows a slight positive correlation between the proportion of Germans and percentage of population with ambulatory disability in the United States with a correlation coefficient (R) of 0.092 and weighted average of 6.5%, a difference of 7.1%.
Ambulatory Disability Correlation Summary
| Measurement | Syrian | German |
| Minimum | 0.77% | 1.7% |
| Maximum | 15.6% | 23.7% |
| Range | 14.8% | 22.0% |
| Mean | 6.5% | 6.6% |
| Median | 5.8% | 6.3% |
| Interquartile 25% (IQ1) | 4.5% | 5.9% |
| Interquartile 75% (IQ3) | 7.0% | 6.8% |
| Interquartile Range (IQR) | 2.5% | 0.93% |
| Standard Deviation (Sample) | 3.0% | 2.2% |
| Standard Deviation (Population) | 3.0% | 2.2% |
Similar Demographics by Ambulatory Disability
Demographics Similar to Syrians by Ambulatory Disability
In terms of ambulatory disability, the demographic groups most similar to Syrians are Immigrants from Croatia (6.0%, a difference of 0.030%), Immigrants from Scotland (6.0%, a difference of 0.23%), Immigrants from Austria (6.0%, a difference of 0.25%), Northern European (6.0%, a difference of 0.25%), and Ghanaian (6.0%, a difference of 0.29%).
| Demographics | Rating | Rank | Ambulatory Disability |
| Immigrants | Greece | 82.5 /100 | #146 | Excellent 6.0% |
| Immigrants | Moldova | 82.4 /100 | #147 | Excellent 6.0% |
| Immigrants | Eastern Europe | 82.0 /100 | #148 | Excellent 6.0% |
| Lithuanians | 81.9 /100 | #149 | Excellent 6.0% |
| Maltese | 81.6 /100 | #150 | Excellent 6.0% |
| Greeks | 79.6 /100 | #151 | Good 6.0% |
| Immigrants | Austria | 78.8 /100 | #152 | Good 6.0% |
| Syrians | 75.5 /100 | #153 | Good 6.0% |
| Immigrants | Croatia | 75.1 /100 | #154 | Good 6.0% |
| Immigrants | Scotland | 72.1 /100 | #155 | Good 6.0% |
| Northern Europeans | 71.8 /100 | #156 | Good 6.0% |
| Ghanaians | 71.3 /100 | #157 | Good 6.0% |
| Immigrants | Fiji | 71.2 /100 | #158 | Good 6.0% |
| Immigrants | Latvia | 71.1 /100 | #159 | Good 6.0% |
| Central Americans | 69.8 /100 | #160 | Good 6.0% |
Demographics Similar to Germans by Ambulatory Disability
In terms of ambulatory disability, the demographic groups most similar to Germans are Immigrants from Panama (6.5%, a difference of 0.0%), Spaniard (6.5%, a difference of 0.020%), Tlingit-Haida (6.5%, a difference of 0.040%), Immigrants from Haiti (6.5%, a difference of 0.050%), and Armenian (6.5%, a difference of 0.050%).
| Demographics | Rating | Rank | Ambulatory Disability |
| Dutch | 2.0 /100 | #236 | Tragic 6.4% |
| Immigrants | Germany | 1.8 /100 | #237 | Tragic 6.4% |
| Haitians | 1.8 /100 | #238 | Tragic 6.4% |
| Senegalese | 1.7 /100 | #239 | Tragic 6.4% |
| Immigrants | Senegal | 1.7 /100 | #240 | Tragic 6.4% |
| Immigrants | Haiti | 1.6 /100 | #241 | Tragic 6.5% |
| Spaniards | 1.6 /100 | #242 | Tragic 6.5% |
| Germans | 1.5 /100 | #243 | Tragic 6.5% |
| Immigrants | Panama | 1.5 /100 | #244 | Tragic 6.5% |
| Tlingit-Haida | 1.5 /100 | #245 | Tragic 6.5% |
| Armenians | 1.5 /100 | #246 | Tragic 6.5% |
| Immigrants | Cuba | 1.4 /100 | #247 | Tragic 6.5% |
| Immigrants | Portugal | 1.4 /100 | #248 | Tragic 6.5% |
| Native Hawaiians | 1.1 /100 | #249 | Tragic 6.5% |
| Chinese | 1.0 /100 | #250 | Tragic 6.5% |