Syrian vs Italian Ambulatory Disability
COMPARE
Syrian
Italian
Ambulatory Disability
Ambulatory Disability Comparison
Syrians
Italians
6.0%
AMBULATORY DISABILITY
75.5/ 100
METRIC RATING
153rd/ 347
METRIC RANK
6.2%
AMBULATORY DISABILITY
22.6/ 100
METRIC RATING
199th/ 347
METRIC RANK
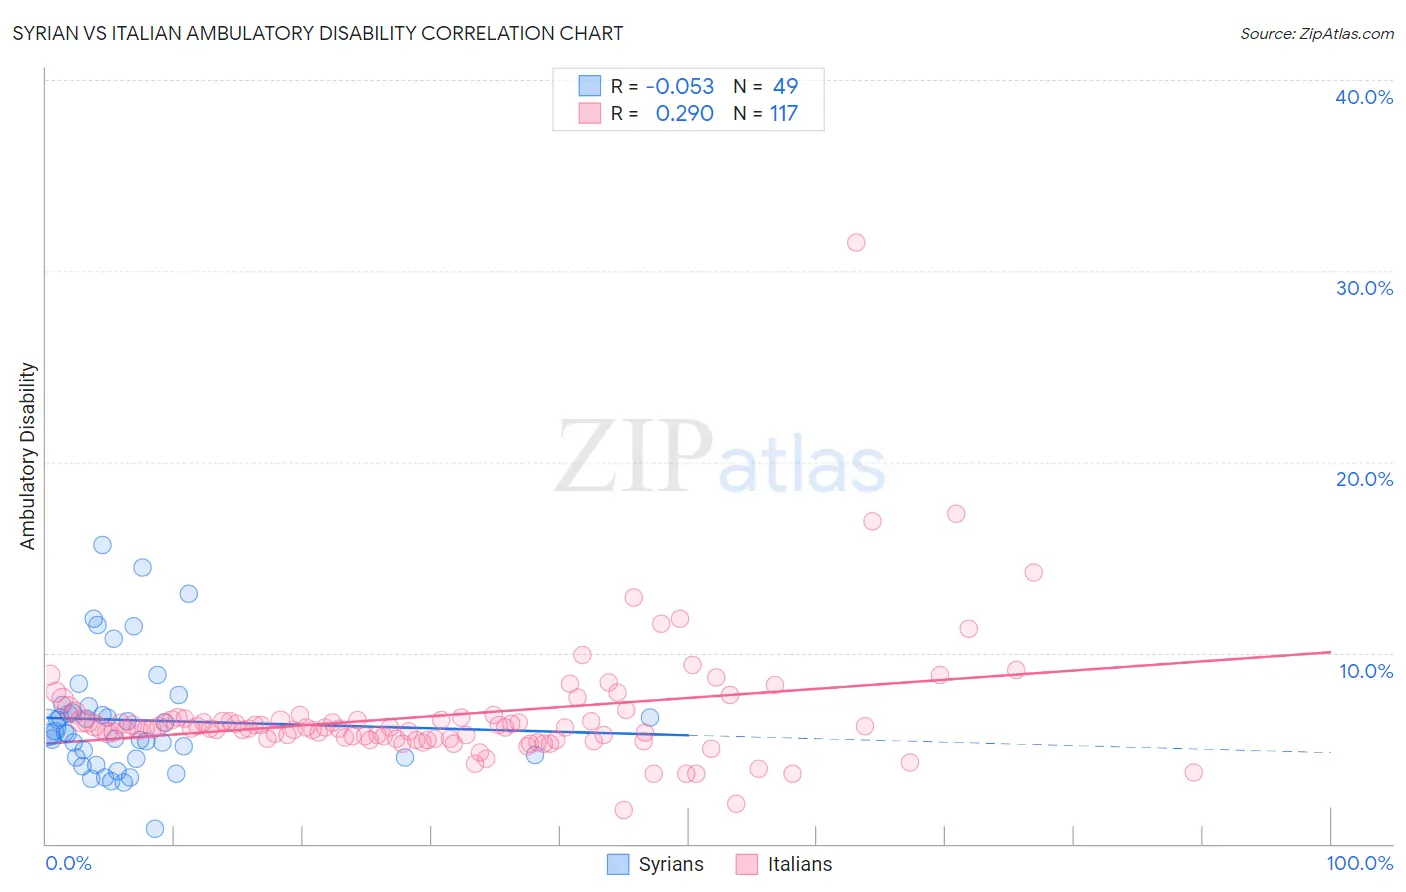
Syrian vs Italian Ambulatory Disability Correlation Chart
The statistical analysis conducted on geographies consisting of 266,278,347 people shows a slight negative correlation between the proportion of Syrians and percentage of population with ambulatory disability in the United States with a correlation coefficient (R) of -0.053 and weighted average of 6.0%. Similarly, the statistical analysis conducted on geographies consisting of 574,457,060 people shows a weak positive correlation between the proportion of Italians and percentage of population with ambulatory disability in the United States with a correlation coefficient (R) of 0.290 and weighted average of 6.2%, a difference of 3.2%.
Ambulatory Disability Correlation Summary
| Measurement | Syrian | Italian |
| Minimum | 0.77% | 1.8% |
| Maximum | 15.6% | 31.5% |
| Range | 14.8% | 29.8% |
| Mean | 6.5% | 6.7% |
| Median | 5.8% | 6.1% |
| Interquartile 25% (IQ1) | 4.5% | 5.5% |
| Interquartile 75% (IQ3) | 7.0% | 6.6% |
| Interquartile Range (IQR) | 2.5% | 1.1% |
| Standard Deviation (Sample) | 3.0% | 3.3% |
| Standard Deviation (Population) | 3.0% | 3.2% |
Similar Demographics by Ambulatory Disability
Demographics Similar to Syrians by Ambulatory Disability
In terms of ambulatory disability, the demographic groups most similar to Syrians are Immigrants from Croatia (6.0%, a difference of 0.030%), Immigrants from Scotland (6.0%, a difference of 0.23%), Immigrants from Austria (6.0%, a difference of 0.25%), Northern European (6.0%, a difference of 0.25%), and Ghanaian (6.0%, a difference of 0.29%).
| Demographics | Rating | Rank | Ambulatory Disability |
| Immigrants | Greece | 82.5 /100 | #146 | Excellent 6.0% |
| Immigrants | Moldova | 82.4 /100 | #147 | Excellent 6.0% |
| Immigrants | Eastern Europe | 82.0 /100 | #148 | Excellent 6.0% |
| Lithuanians | 81.9 /100 | #149 | Excellent 6.0% |
| Maltese | 81.6 /100 | #150 | Excellent 6.0% |
| Greeks | 79.6 /100 | #151 | Good 6.0% |
| Immigrants | Austria | 78.8 /100 | #152 | Good 6.0% |
| Syrians | 75.5 /100 | #153 | Good 6.0% |
| Immigrants | Croatia | 75.1 /100 | #154 | Good 6.0% |
| Immigrants | Scotland | 72.1 /100 | #155 | Good 6.0% |
| Northern Europeans | 71.8 /100 | #156 | Good 6.0% |
| Ghanaians | 71.3 /100 | #157 | Good 6.0% |
| Immigrants | Fiji | 71.2 /100 | #158 | Good 6.0% |
| Immigrants | Latvia | 71.1 /100 | #159 | Good 6.0% |
| Central Americans | 69.8 /100 | #160 | Good 6.0% |
Demographics Similar to Italians by Ambulatory Disability
In terms of ambulatory disability, the demographic groups most similar to Italians are Immigrants from Cambodia (6.2%, a difference of 0.080%), Immigrants from Bangladesh (6.2%, a difference of 0.14%), Immigrants from Central America (6.2%, a difference of 0.20%), Albanian (6.2%, a difference of 0.22%), and Polish (6.2%, a difference of 0.26%).
| Demographics | Rating | Rank | Ambulatory Disability |
| Immigrants | Western Europe | 31.6 /100 | #192 | Fair 6.2% |
| Guatemalans | 30.0 /100 | #193 | Fair 6.2% |
| Alaska Natives | 29.8 /100 | #194 | Fair 6.2% |
| Belgians | 28.6 /100 | #195 | Fair 6.2% |
| Malaysians | 28.2 /100 | #196 | Fair 6.2% |
| Poles | 26.3 /100 | #197 | Fair 6.2% |
| Immigrants | Bangladesh | 24.6 /100 | #198 | Fair 6.2% |
| Italians | 22.6 /100 | #199 | Fair 6.2% |
| Immigrants | Cambodia | 21.5 /100 | #200 | Fair 6.2% |
| Immigrants | Central America | 20.1 /100 | #201 | Fair 6.2% |
| Albanians | 19.7 /100 | #202 | Poor 6.2% |
| Immigrants | Ukraine | 18.4 /100 | #203 | Poor 6.2% |
| Immigrants | Congo | 18.2 /100 | #204 | Poor 6.2% |
| Slovenes | 18.0 /100 | #205 | Poor 6.2% |
| Finns | 17.2 /100 | #206 | Poor 6.2% |