Syrian vs Immigrants from Micronesia Ambulatory Disability
COMPARE
Syrian
Immigrants from Micronesia
Ambulatory Disability
Ambulatory Disability Comparison
Syrians
Immigrants from Micronesia
6.0%
AMBULATORY DISABILITY
75.5/ 100
METRIC RATING
153rd/ 347
METRIC RANK
7.0%
AMBULATORY DISABILITY
0.0/ 100
METRIC RATING
305th/ 347
METRIC RANK
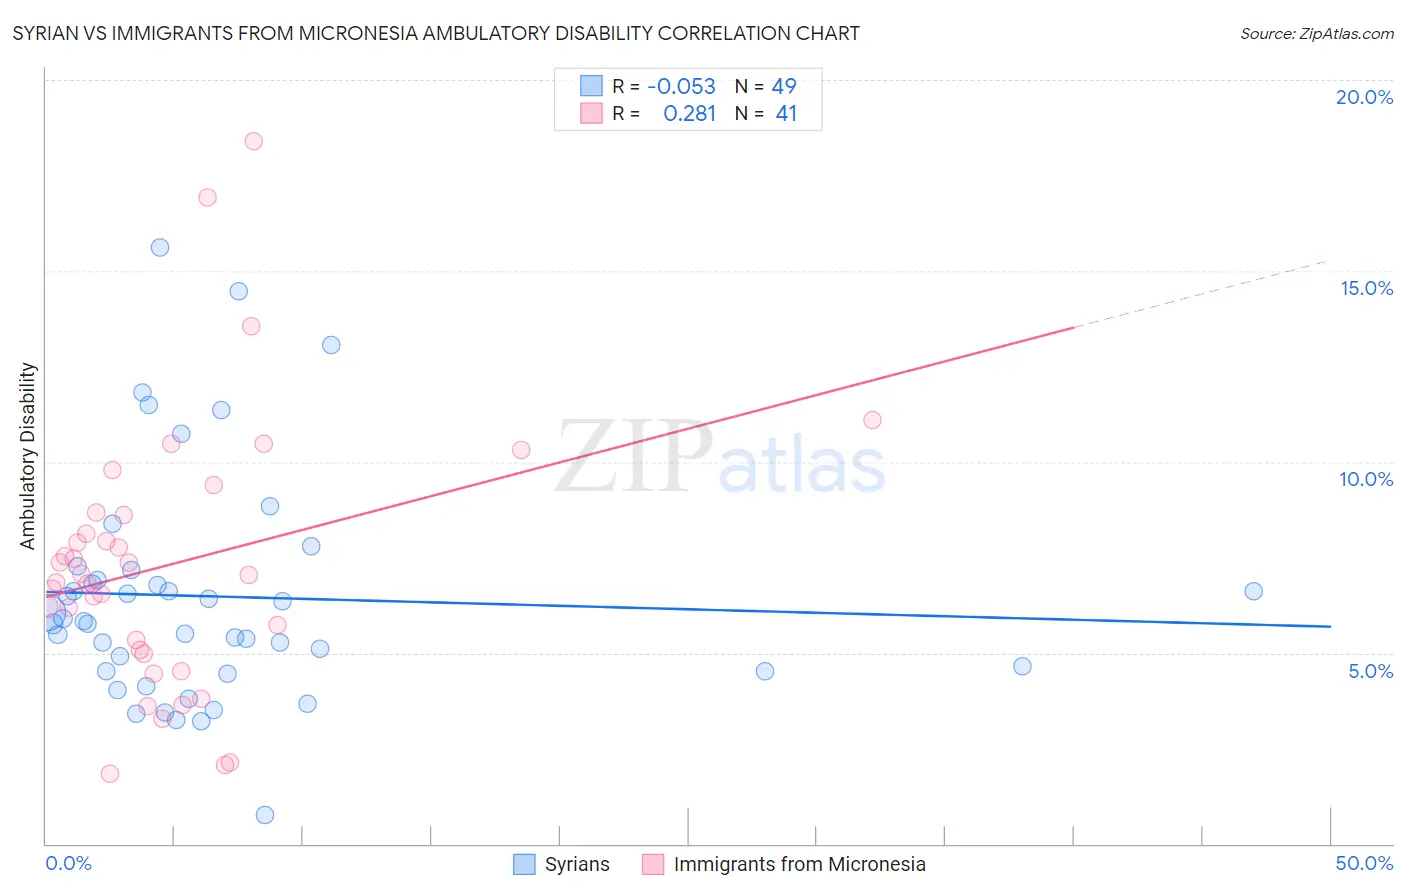
Syrian vs Immigrants from Micronesia Ambulatory Disability Correlation Chart
The statistical analysis conducted on geographies consisting of 266,278,347 people shows a slight negative correlation between the proportion of Syrians and percentage of population with ambulatory disability in the United States with a correlation coefficient (R) of -0.053 and weighted average of 6.0%. Similarly, the statistical analysis conducted on geographies consisting of 61,585,357 people shows a weak positive correlation between the proportion of Immigrants from Micronesia and percentage of population with ambulatory disability in the United States with a correlation coefficient (R) of 0.281 and weighted average of 7.0%, a difference of 16.4%.
Ambulatory Disability Correlation Summary
| Measurement | Syrian | Immigrants from Micronesia |
| Minimum | 0.77% | 1.8% |
| Maximum | 15.6% | 18.4% |
| Range | 14.8% | 16.6% |
| Mean | 6.5% | 7.3% |
| Median | 5.8% | 7.0% |
| Interquartile 25% (IQ1) | 4.5% | 5.0% |
| Interquartile 75% (IQ3) | 7.0% | 8.6% |
| Interquartile Range (IQR) | 2.5% | 3.6% |
| Standard Deviation (Sample) | 3.0% | 3.5% |
| Standard Deviation (Population) | 3.0% | 3.5% |
Similar Demographics by Ambulatory Disability
Demographics Similar to Syrians by Ambulatory Disability
In terms of ambulatory disability, the demographic groups most similar to Syrians are Immigrants from Croatia (6.0%, a difference of 0.030%), Immigrants from Scotland (6.0%, a difference of 0.23%), Immigrants from Austria (6.0%, a difference of 0.25%), Northern European (6.0%, a difference of 0.25%), and Ghanaian (6.0%, a difference of 0.29%).
| Demographics | Rating | Rank | Ambulatory Disability |
| Immigrants | Greece | 82.5 /100 | #146 | Excellent 6.0% |
| Immigrants | Moldova | 82.4 /100 | #147 | Excellent 6.0% |
| Immigrants | Eastern Europe | 82.0 /100 | #148 | Excellent 6.0% |
| Lithuanians | 81.9 /100 | #149 | Excellent 6.0% |
| Maltese | 81.6 /100 | #150 | Excellent 6.0% |
| Greeks | 79.6 /100 | #151 | Good 6.0% |
| Immigrants | Austria | 78.8 /100 | #152 | Good 6.0% |
| Syrians | 75.5 /100 | #153 | Good 6.0% |
| Immigrants | Croatia | 75.1 /100 | #154 | Good 6.0% |
| Immigrants | Scotland | 72.1 /100 | #155 | Good 6.0% |
| Northern Europeans | 71.8 /100 | #156 | Good 6.0% |
| Ghanaians | 71.3 /100 | #157 | Good 6.0% |
| Immigrants | Fiji | 71.2 /100 | #158 | Good 6.0% |
| Immigrants | Latvia | 71.1 /100 | #159 | Good 6.0% |
| Central Americans | 69.8 /100 | #160 | Good 6.0% |
Demographics Similar to Immigrants from Micronesia by Ambulatory Disability
In terms of ambulatory disability, the demographic groups most similar to Immigrants from Micronesia are Immigrants from Cabo Verde (7.0%, a difference of 0.29%), Iroquois (7.1%, a difference of 0.53%), African (7.0%, a difference of 0.64%), Immigrants from Armenia (7.0%, a difference of 0.70%), and British West Indian (7.0%, a difference of 0.76%).
| Demographics | Rating | Rank | Ambulatory Disability |
| Immigrants | Grenada | 0.0 /100 | #298 | Tragic 6.9% |
| Puget Sound Salish | 0.0 /100 | #299 | Tragic 6.9% |
| Marshallese | 0.0 /100 | #300 | Tragic 6.9% |
| British West Indians | 0.0 /100 | #301 | Tragic 7.0% |
| Immigrants | Armenia | 0.0 /100 | #302 | Tragic 7.0% |
| Africans | 0.0 /100 | #303 | Tragic 7.0% |
| Immigrants | Cabo Verde | 0.0 /100 | #304 | Tragic 7.0% |
| Immigrants | Micronesia | 0.0 /100 | #305 | Tragic 7.0% |
| Iroquois | 0.0 /100 | #306 | Tragic 7.1% |
| Spanish Americans | 0.0 /100 | #307 | Tragic 7.1% |
| Chippewa | 0.0 /100 | #308 | Tragic 7.1% |
| Immigrants | Azores | 0.0 /100 | #309 | Tragic 7.1% |
| Arapaho | 0.0 /100 | #310 | Tragic 7.1% |
| Cree | 0.0 /100 | #311 | Tragic 7.1% |
| Delaware | 0.0 /100 | #312 | Tragic 7.1% |