Swiss vs Immigrants from Micronesia Vision Disability
COMPARE
Swiss
Immigrants from Micronesia
Vision Disability
Vision Disability Comparison
Swiss
Immigrants from Micronesia
2.2%
VISION DISABILITY
55.7/ 100
METRIC RATING
170th/ 347
METRIC RANK
2.4%
VISION DISABILITY
0.3/ 100
METRIC RATING
252nd/ 347
METRIC RANK
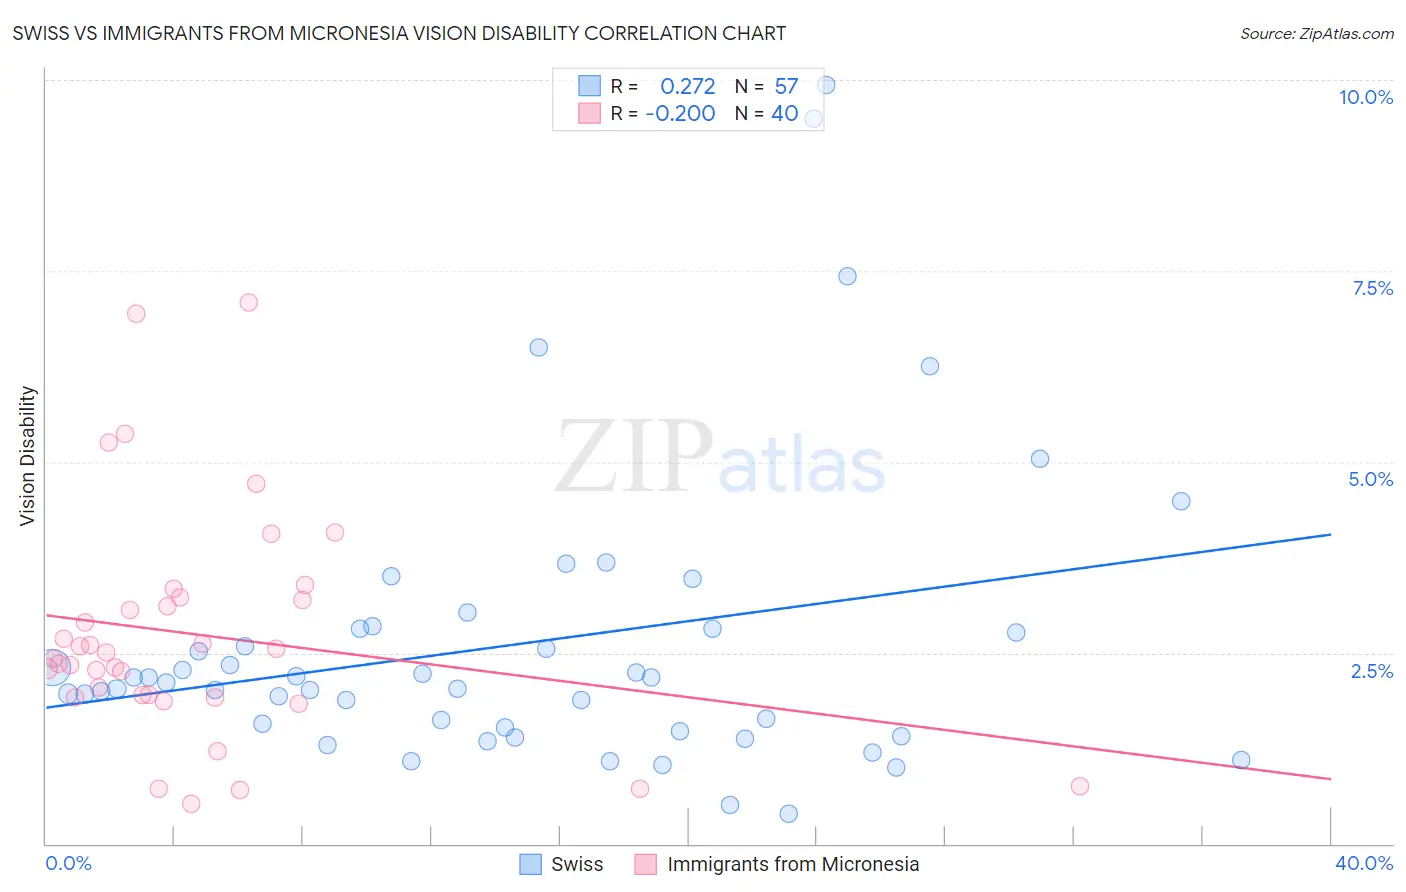
Swiss vs Immigrants from Micronesia Vision Disability Correlation Chart
The statistical analysis conducted on geographies consisting of 464,374,244 people shows a weak positive correlation between the proportion of Swiss and percentage of population with vision disability in the United States with a correlation coefficient (R) of 0.272 and weighted average of 2.2%. Similarly, the statistical analysis conducted on geographies consisting of 61,592,184 people shows a weak negative correlation between the proportion of Immigrants from Micronesia and percentage of population with vision disability in the United States with a correlation coefficient (R) of -0.200 and weighted average of 2.4%, a difference of 9.3%.
Vision Disability Correlation Summary
| Measurement | Swiss | Immigrants from Micronesia |
| Minimum | 0.39% | 0.53% |
| Maximum | 9.9% | 7.1% |
| Range | 9.6% | 6.5% |
| Mean | 2.6% | 2.7% |
| Median | 2.1% | 2.5% |
| Interquartile 25% (IQ1) | 1.5% | 1.9% |
| Interquartile 75% (IQ3) | 2.8% | 3.2% |
| Interquartile Range (IQR) | 1.3% | 1.3% |
| Standard Deviation (Sample) | 1.9% | 1.5% |
| Standard Deviation (Population) | 1.9% | 1.5% |
Similar Demographics by Vision Disability
Demographics Similar to Swiss by Vision Disability
In terms of vision disability, the demographic groups most similar to Swiss are Lebanese (2.2%, a difference of 0.090%), South American Indian (2.2%, a difference of 0.11%), Northern European (2.2%, a difference of 0.36%), Scandinavian (2.2%, a difference of 0.36%), and Immigrants from Canada (2.2%, a difference of 0.36%).
| Demographics | Rating | Rank | Vision Disability |
| Icelanders | 66.1 /100 | #163 | Good 2.1% |
| Immigrants | Bangladesh | 65.5 /100 | #164 | Good 2.1% |
| Immigrants | Iraq | 64.8 /100 | #165 | Good 2.1% |
| Immigrants | England | 62.8 /100 | #166 | Good 2.1% |
| Immigrants | Africa | 62.6 /100 | #167 | Good 2.1% |
| Brazilians | 62.2 /100 | #168 | Good 2.1% |
| South American Indians | 57.4 /100 | #169 | Average 2.2% |
| Swiss | 55.7 /100 | #170 | Average 2.2% |
| Lebanese | 54.3 /100 | #171 | Average 2.2% |
| Northern Europeans | 50.1 /100 | #172 | Average 2.2% |
| Scandinavians | 50.0 /100 | #173 | Average 2.2% |
| Immigrants | Canada | 50.0 /100 | #174 | Average 2.2% |
| Immigrants | Fiji | 47.6 /100 | #175 | Average 2.2% |
| Yugoslavians | 46.5 /100 | #176 | Average 2.2% |
| Slavs | 46.0 /100 | #177 | Average 2.2% |
Demographics Similar to Immigrants from Micronesia by Vision Disability
In terms of vision disability, the demographic groups most similar to Immigrants from Micronesia are Japanese (2.4%, a difference of 0.070%), Immigrants from Laos (2.4%, a difference of 0.32%), Haitian (2.4%, a difference of 0.35%), Immigrants from Guatemala (2.4%, a difference of 0.38%), and Bangladeshi (2.3%, a difference of 0.43%).
| Demographics | Rating | Rank | Vision Disability |
| Alsatians | 0.6 /100 | #245 | Tragic 2.3% |
| French | 0.5 /100 | #246 | Tragic 2.3% |
| Guatemalans | 0.5 /100 | #247 | Tragic 2.3% |
| Sub-Saharan Africans | 0.5 /100 | #248 | Tragic 2.3% |
| Liberians | 0.5 /100 | #249 | Tragic 2.3% |
| Bangladeshis | 0.5 /100 | #250 | Tragic 2.3% |
| Immigrants | Laos | 0.4 /100 | #251 | Tragic 2.4% |
| Immigrants | Micronesia | 0.3 /100 | #252 | Tragic 2.4% |
| Japanese | 0.3 /100 | #253 | Tragic 2.4% |
| Haitians | 0.3 /100 | #254 | Tragic 2.4% |
| Immigrants | Guatemala | 0.3 /100 | #255 | Tragic 2.4% |
| Immigrants | Haiti | 0.2 /100 | #256 | Tragic 2.4% |
| West Indians | 0.2 /100 | #257 | Tragic 2.4% |
| British West Indians | 0.2 /100 | #258 | Tragic 2.4% |
| Whites/Caucasians | 0.2 /100 | #259 | Tragic 2.4% |