Swiss vs Immigrants from Bahamas Vision Disability
COMPARE
Swiss
Immigrants from Bahamas
Vision Disability
Vision Disability Comparison
Swiss
Immigrants from Bahamas
2.2%
VISION DISABILITY
55.7/ 100
METRIC RATING
170th/ 347
METRIC RANK
2.4%
VISION DISABILITY
0.1/ 100
METRIC RATING
273rd/ 347
METRIC RANK
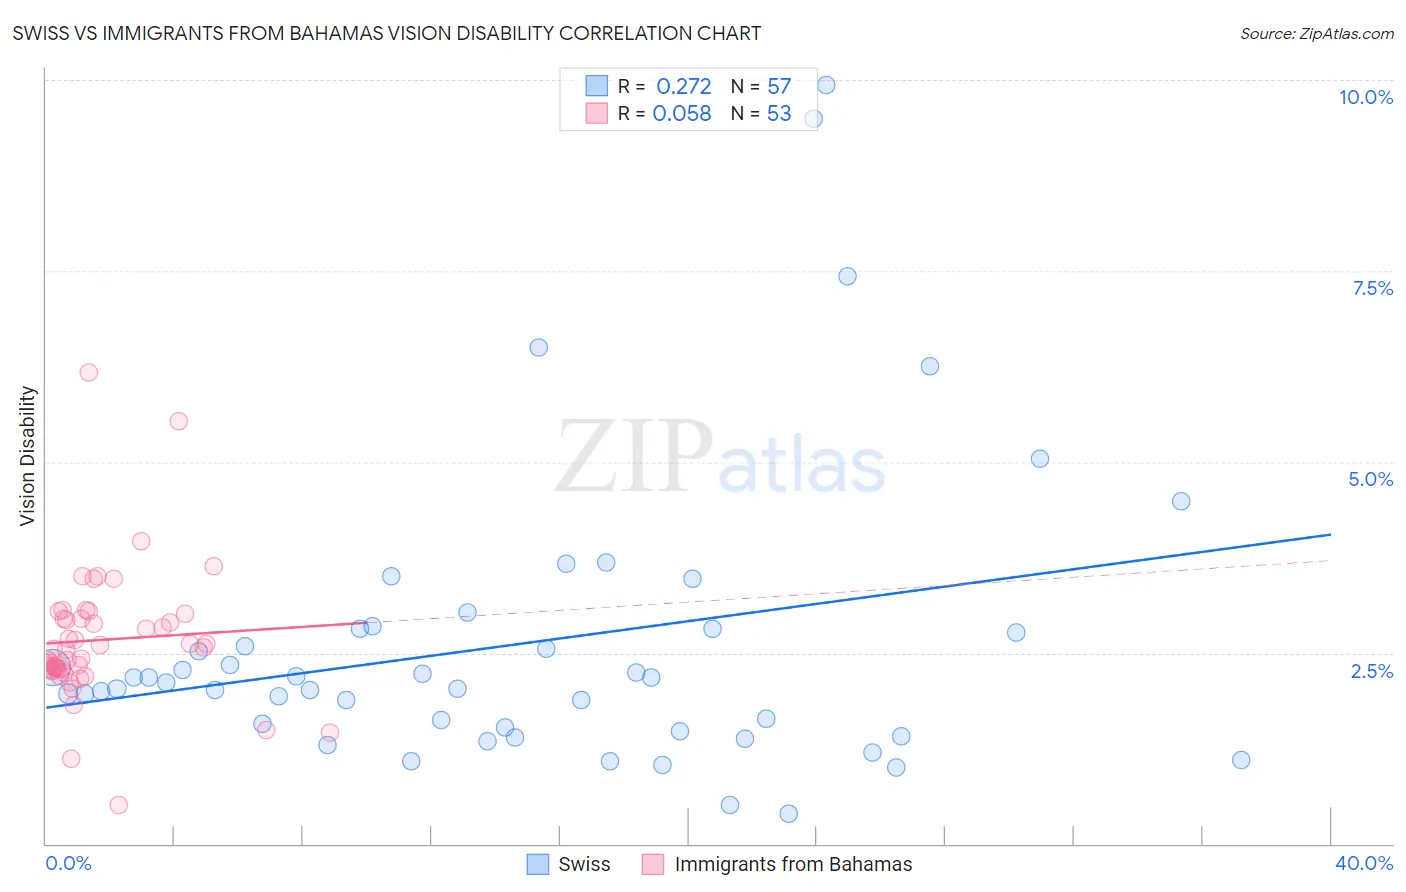
Swiss vs Immigrants from Bahamas Vision Disability Correlation Chart
The statistical analysis conducted on geographies consisting of 464,374,244 people shows a weak positive correlation between the proportion of Swiss and percentage of population with vision disability in the United States with a correlation coefficient (R) of 0.272 and weighted average of 2.2%. Similarly, the statistical analysis conducted on geographies consisting of 104,644,216 people shows a slight positive correlation between the proportion of Immigrants from Bahamas and percentage of population with vision disability in the United States with a correlation coefficient (R) of 0.058 and weighted average of 2.4%, a difference of 12.2%.
Vision Disability Correlation Summary
| Measurement | Swiss | Immigrants from Bahamas |
| Minimum | 0.39% | 0.51% |
| Maximum | 9.9% | 6.2% |
| Range | 9.6% | 5.7% |
| Mean | 2.6% | 2.7% |
| Median | 2.1% | 2.5% |
| Interquartile 25% (IQ1) | 1.5% | 2.3% |
| Interquartile 75% (IQ3) | 2.8% | 3.0% |
| Interquartile Range (IQR) | 1.3% | 0.70% |
| Standard Deviation (Sample) | 1.9% | 0.89% |
| Standard Deviation (Population) | 1.9% | 0.88% |
Similar Demographics by Vision Disability
Demographics Similar to Swiss by Vision Disability
In terms of vision disability, the demographic groups most similar to Swiss are Lebanese (2.2%, a difference of 0.090%), South American Indian (2.2%, a difference of 0.11%), Northern European (2.2%, a difference of 0.36%), Scandinavian (2.2%, a difference of 0.36%), and Immigrants from Canada (2.2%, a difference of 0.36%).
| Demographics | Rating | Rank | Vision Disability |
| Icelanders | 66.1 /100 | #163 | Good 2.1% |
| Immigrants | Bangladesh | 65.5 /100 | #164 | Good 2.1% |
| Immigrants | Iraq | 64.8 /100 | #165 | Good 2.1% |
| Immigrants | England | 62.8 /100 | #166 | Good 2.1% |
| Immigrants | Africa | 62.6 /100 | #167 | Good 2.1% |
| Brazilians | 62.2 /100 | #168 | Good 2.1% |
| South American Indians | 57.4 /100 | #169 | Average 2.2% |
| Swiss | 55.7 /100 | #170 | Average 2.2% |
| Lebanese | 54.3 /100 | #171 | Average 2.2% |
| Northern Europeans | 50.1 /100 | #172 | Average 2.2% |
| Scandinavians | 50.0 /100 | #173 | Average 2.2% |
| Immigrants | Canada | 50.0 /100 | #174 | Average 2.2% |
| Immigrants | Fiji | 47.6 /100 | #175 | Average 2.2% |
| Yugoslavians | 46.5 /100 | #176 | Average 2.2% |
| Slavs | 46.0 /100 | #177 | Average 2.2% |
Demographics Similar to Immigrants from Bahamas by Vision Disability
In terms of vision disability, the demographic groups most similar to Immigrants from Bahamas are Immigrants from Latin America (2.4%, a difference of 0.31%), Spaniard (2.4%, a difference of 0.33%), Immigrants from the Azores (2.4%, a difference of 0.43%), Cuban (2.4%, a difference of 0.59%), and Celtic (2.4%, a difference of 0.60%).
| Demographics | Rating | Rank | Vision Disability |
| Mexican American Indians | 0.1 /100 | #266 | Tragic 2.4% |
| Ute | 0.1 /100 | #267 | Tragic 2.4% |
| Senegalese | 0.1 /100 | #268 | Tragic 2.4% |
| Celtics | 0.1 /100 | #269 | Tragic 2.4% |
| Cubans | 0.1 /100 | #270 | Tragic 2.4% |
| Immigrants | Azores | 0.1 /100 | #271 | Tragic 2.4% |
| Spaniards | 0.1 /100 | #272 | Tragic 2.4% |
| Immigrants | Bahamas | 0.1 /100 | #273 | Tragic 2.4% |
| Immigrants | Latin America | 0.0 /100 | #274 | Tragic 2.4% |
| Chippewa | 0.0 /100 | #275 | Tragic 2.4% |
| Scotch-Irish | 0.0 /100 | #276 | Tragic 2.4% |
| Bahamians | 0.0 /100 | #277 | Tragic 2.4% |
| Spanish | 0.0 /100 | #278 | Tragic 2.4% |
| Nepalese | 0.0 /100 | #279 | Tragic 2.4% |
| Cape Verdeans | 0.0 /100 | #280 | Tragic 2.4% |