Colville vs Immigrants from Micronesia Vision Disability
COMPARE
Colville
Immigrants from Micronesia
Vision Disability
Vision Disability Comparison
Colville
Immigrants from Micronesia
3.0%
VISION DISABILITY
0.0/ 100
METRIC RATING
330th/ 347
METRIC RANK
2.4%
VISION DISABILITY
0.3/ 100
METRIC RATING
252nd/ 347
METRIC RANK
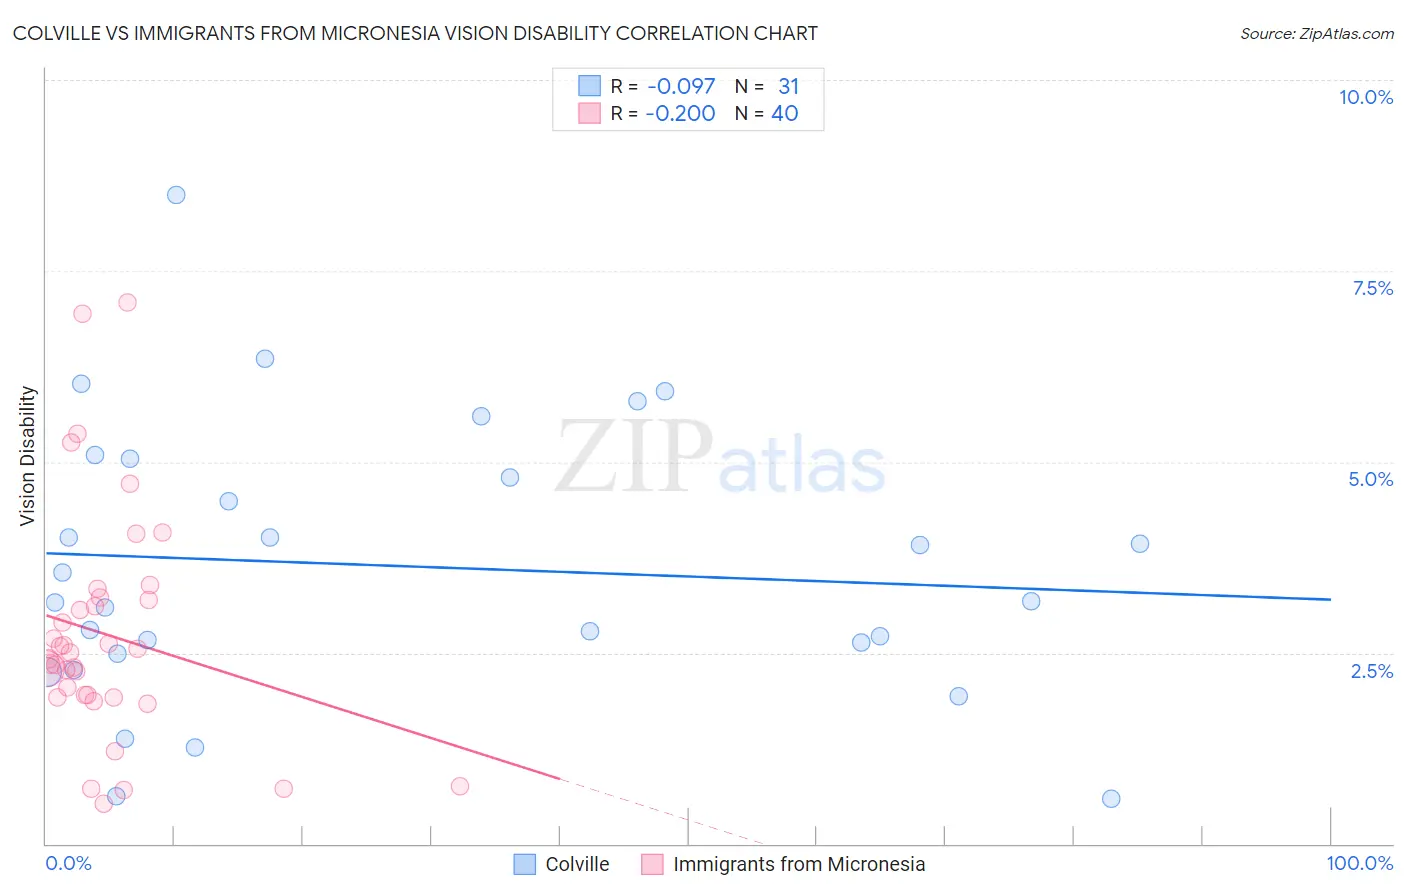
Colville vs Immigrants from Micronesia Vision Disability Correlation Chart
The statistical analysis conducted on geographies consisting of 34,683,927 people shows a slight negative correlation between the proportion of Colville and percentage of population with vision disability in the United States with a correlation coefficient (R) of -0.097 and weighted average of 3.0%. Similarly, the statistical analysis conducted on geographies consisting of 61,592,184 people shows a weak negative correlation between the proportion of Immigrants from Micronesia and percentage of population with vision disability in the United States with a correlation coefficient (R) of -0.200 and weighted average of 2.4%, a difference of 28.3%.
Vision Disability Correlation Summary
| Measurement | Colville | Immigrants from Micronesia |
| Minimum | 0.59% | 0.53% |
| Maximum | 8.5% | 7.1% |
| Range | 7.9% | 6.5% |
| Mean | 3.6% | 2.7% |
| Median | 3.2% | 2.5% |
| Interquartile 25% (IQ1) | 2.5% | 1.9% |
| Interquartile 75% (IQ3) | 5.0% | 3.2% |
| Interquartile Range (IQR) | 2.5% | 1.3% |
| Standard Deviation (Sample) | 1.8% | 1.5% |
| Standard Deviation (Population) | 1.8% | 1.5% |
Similar Demographics by Vision Disability
Demographics Similar to Colville by Vision Disability
In terms of vision disability, the demographic groups most similar to Colville are Central American Indian (3.0%, a difference of 0.64%), Seminole (3.1%, a difference of 1.1%), Cajun (3.1%, a difference of 1.1%), Apache (3.0%, a difference of 1.2%), and Yuman (3.0%, a difference of 1.4%).
| Demographics | Rating | Rank | Vision Disability |
| Tlingit-Haida | 0.0 /100 | #323 | Tragic 2.9% |
| Hopi | 0.0 /100 | #324 | Tragic 2.9% |
| Cherokee | 0.0 /100 | #325 | Tragic 2.9% |
| Spanish Americans | 0.0 /100 | #326 | Tragic 2.9% |
| Natives/Alaskans | 0.0 /100 | #327 | Tragic 3.0% |
| Yuman | 0.0 /100 | #328 | Tragic 3.0% |
| Apache | 0.0 /100 | #329 | Tragic 3.0% |
| Colville | 0.0 /100 | #330 | Tragic 3.0% |
| Central American Indians | 0.0 /100 | #331 | Tragic 3.0% |
| Seminole | 0.0 /100 | #332 | Tragic 3.1% |
| Cajuns | 0.0 /100 | #333 | Tragic 3.1% |
| Cheyenne | 0.0 /100 | #334 | Tragic 3.1% |
| Navajo | 0.0 /100 | #335 | Tragic 3.1% |
| Alaskan Athabascans | 0.0 /100 | #336 | Tragic 3.1% |
| Dutch West Indians | 0.0 /100 | #337 | Tragic 3.2% |
Demographics Similar to Immigrants from Micronesia by Vision Disability
In terms of vision disability, the demographic groups most similar to Immigrants from Micronesia are Japanese (2.4%, a difference of 0.070%), Immigrants from Laos (2.4%, a difference of 0.32%), Haitian (2.4%, a difference of 0.35%), Immigrants from Guatemala (2.4%, a difference of 0.38%), and Bangladeshi (2.3%, a difference of 0.43%).
| Demographics | Rating | Rank | Vision Disability |
| Alsatians | 0.6 /100 | #245 | Tragic 2.3% |
| French | 0.5 /100 | #246 | Tragic 2.3% |
| Guatemalans | 0.5 /100 | #247 | Tragic 2.3% |
| Sub-Saharan Africans | 0.5 /100 | #248 | Tragic 2.3% |
| Liberians | 0.5 /100 | #249 | Tragic 2.3% |
| Bangladeshis | 0.5 /100 | #250 | Tragic 2.3% |
| Immigrants | Laos | 0.4 /100 | #251 | Tragic 2.4% |
| Immigrants | Micronesia | 0.3 /100 | #252 | Tragic 2.4% |
| Japanese | 0.3 /100 | #253 | Tragic 2.4% |
| Haitians | 0.3 /100 | #254 | Tragic 2.4% |
| Immigrants | Guatemala | 0.3 /100 | #255 | Tragic 2.4% |
| Immigrants | Haiti | 0.2 /100 | #256 | Tragic 2.4% |
| West Indians | 0.2 /100 | #257 | Tragic 2.4% |
| British West Indians | 0.2 /100 | #258 | Tragic 2.4% |
| Whites/Caucasians | 0.2 /100 | #259 | Tragic 2.4% |