Vietnamese vs Immigrants from Micronesia Vision Disability
COMPARE
Vietnamese
Immigrants from Micronesia
Vision Disability
Vision Disability Comparison
Vietnamese
Immigrants from Micronesia
2.1%
VISION DISABILITY
86.7/ 100
METRIC RATING
135th/ 347
METRIC RANK
2.4%
VISION DISABILITY
0.3/ 100
METRIC RATING
252nd/ 347
METRIC RANK
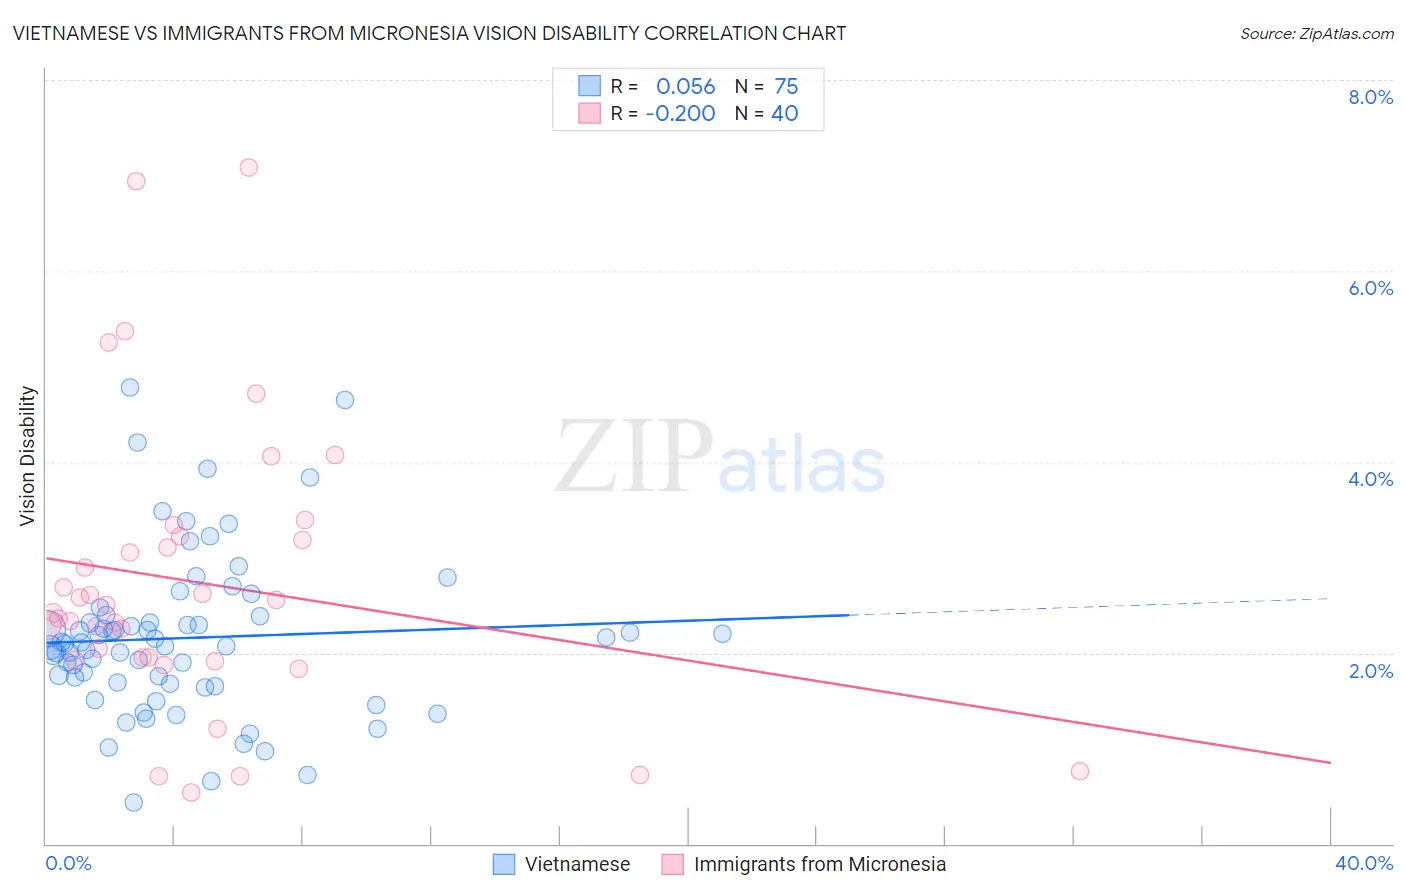
Vietnamese vs Immigrants from Micronesia Vision Disability Correlation Chart
The statistical analysis conducted on geographies consisting of 170,695,405 people shows a slight positive correlation between the proportion of Vietnamese and percentage of population with vision disability in the United States with a correlation coefficient (R) of 0.056 and weighted average of 2.1%. Similarly, the statistical analysis conducted on geographies consisting of 61,592,184 people shows a weak negative correlation between the proportion of Immigrants from Micronesia and percentage of population with vision disability in the United States with a correlation coefficient (R) of -0.200 and weighted average of 2.4%, a difference of 12.2%.
Vision Disability Correlation Summary
| Measurement | Vietnamese | Immigrants from Micronesia |
| Minimum | 0.44% | 0.53% |
| Maximum | 4.8% | 7.1% |
| Range | 4.3% | 6.5% |
| Mean | 2.2% | 2.7% |
| Median | 2.1% | 2.5% |
| Interquartile 25% (IQ1) | 1.7% | 1.9% |
| Interquartile 75% (IQ3) | 2.4% | 3.2% |
| Interquartile Range (IQR) | 0.72% | 1.3% |
| Standard Deviation (Sample) | 0.84% | 1.5% |
| Standard Deviation (Population) | 0.84% | 1.5% |
Similar Demographics by Vision Disability
Demographics Similar to Vietnamese by Vision Disability
In terms of vision disability, the demographic groups most similar to Vietnamese are Czech (2.1%, a difference of 0.050%), Immigrants from South Eastern Asia (2.1%, a difference of 0.050%), Arab (2.1%, a difference of 0.060%), Venezuelan (2.1%, a difference of 0.070%), and Syrian (2.1%, a difference of 0.12%).
| Demographics | Rating | Rank | Vision Disability |
| Immigrants | Chile | 89.0 /100 | #128 | Excellent 2.1% |
| Immigrants | Cameroon | 88.8 /100 | #129 | Excellent 2.1% |
| Immigrants | Kenya | 88.7 /100 | #130 | Excellent 2.1% |
| Immigrants | Hungary | 88.7 /100 | #131 | Excellent 2.1% |
| New Zealanders | 88.2 /100 | #132 | Excellent 2.1% |
| Syrians | 87.5 /100 | #133 | Excellent 2.1% |
| Venezuelans | 87.2 /100 | #134 | Excellent 2.1% |
| Vietnamese | 86.7 /100 | #135 | Excellent 2.1% |
| Czechs | 86.3 /100 | #136 | Excellent 2.1% |
| Immigrants | South Eastern Asia | 86.3 /100 | #137 | Excellent 2.1% |
| Arabs | 86.3 /100 | #138 | Excellent 2.1% |
| Immigrants | Morocco | 85.2 /100 | #139 | Excellent 2.1% |
| Immigrants | Netherlands | 84.2 /100 | #140 | Excellent 2.1% |
| Sierra Leoneans | 84.1 /100 | #141 | Excellent 2.1% |
| South Americans | 82.8 /100 | #142 | Excellent 2.1% |
Demographics Similar to Immigrants from Micronesia by Vision Disability
In terms of vision disability, the demographic groups most similar to Immigrants from Micronesia are Japanese (2.4%, a difference of 0.070%), Immigrants from Laos (2.4%, a difference of 0.32%), Haitian (2.4%, a difference of 0.35%), Immigrants from Guatemala (2.4%, a difference of 0.38%), and Bangladeshi (2.3%, a difference of 0.43%).
| Demographics | Rating | Rank | Vision Disability |
| Alsatians | 0.6 /100 | #245 | Tragic 2.3% |
| French | 0.5 /100 | #246 | Tragic 2.3% |
| Guatemalans | 0.5 /100 | #247 | Tragic 2.3% |
| Sub-Saharan Africans | 0.5 /100 | #248 | Tragic 2.3% |
| Liberians | 0.5 /100 | #249 | Tragic 2.3% |
| Bangladeshis | 0.5 /100 | #250 | Tragic 2.3% |
| Immigrants | Laos | 0.4 /100 | #251 | Tragic 2.4% |
| Immigrants | Micronesia | 0.3 /100 | #252 | Tragic 2.4% |
| Japanese | 0.3 /100 | #253 | Tragic 2.4% |
| Haitians | 0.3 /100 | #254 | Tragic 2.4% |
| Immigrants | Guatemala | 0.3 /100 | #255 | Tragic 2.4% |
| Immigrants | Haiti | 0.2 /100 | #256 | Tragic 2.4% |
| West Indians | 0.2 /100 | #257 | Tragic 2.4% |
| British West Indians | 0.2 /100 | #258 | Tragic 2.4% |
| Whites/Caucasians | 0.2 /100 | #259 | Tragic 2.4% |