Swiss vs Immigrants from Micronesia Doctorate Degree
COMPARE
Swiss
Immigrants from Micronesia
Doctorate Degree
Doctorate Degree Comparison
Swiss
Immigrants from Micronesia
2.0%
DOCTORATE DEGREE
88.0/ 100
METRIC RATING
138th/ 347
METRIC RANK
1.3%
DOCTORATE DEGREE
0.1/ 100
METRIC RATING
317th/ 347
METRIC RANK
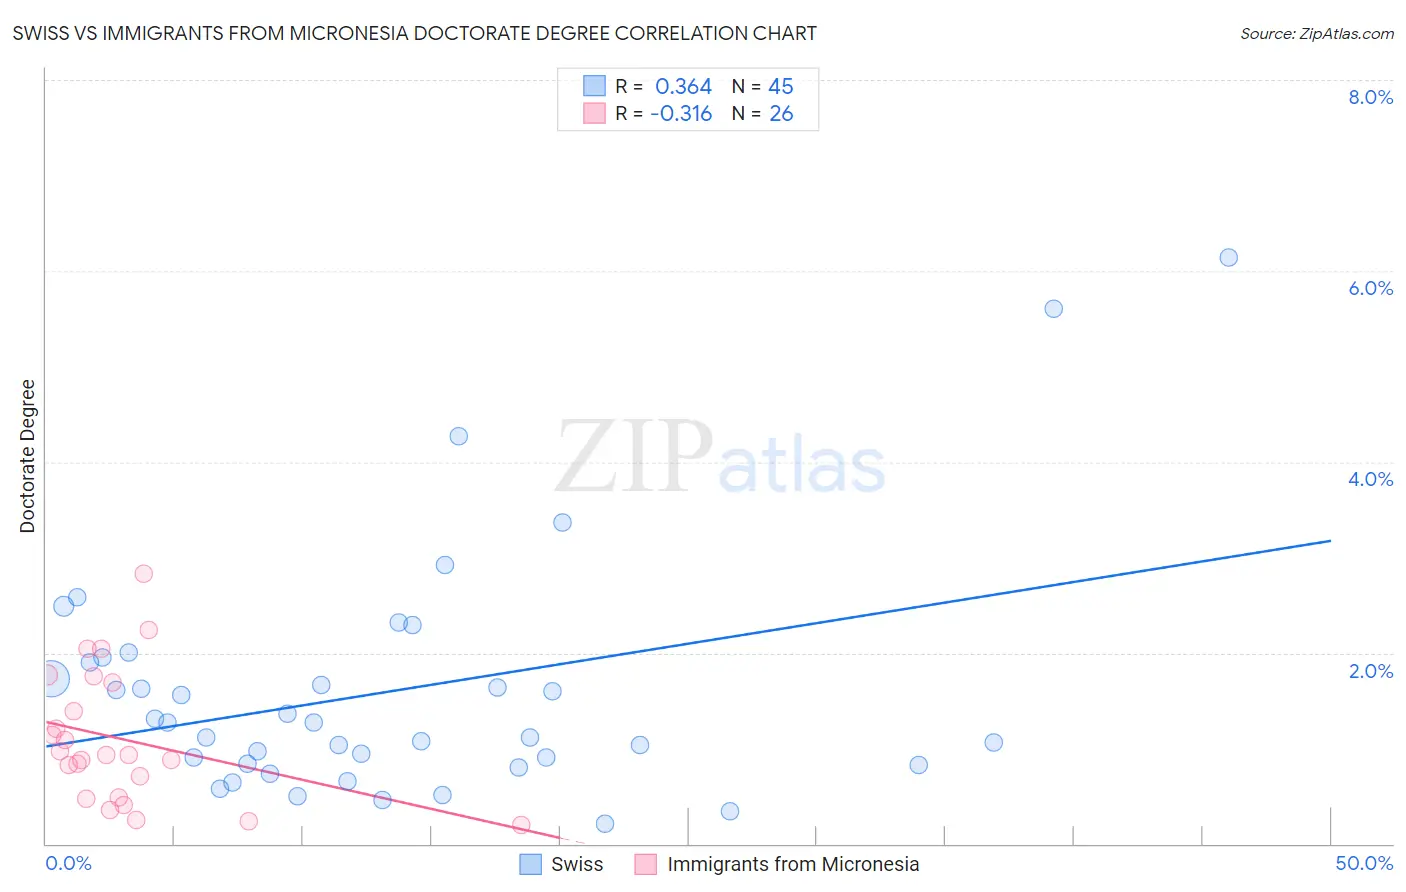
Swiss vs Immigrants from Micronesia Doctorate Degree Correlation Chart
The statistical analysis conducted on geographies consisting of 455,851,671 people shows a mild positive correlation between the proportion of Swiss and percentage of population with at least doctorate degree education in the United States with a correlation coefficient (R) of 0.364 and weighted average of 2.0%. Similarly, the statistical analysis conducted on geographies consisting of 61,316,353 people shows a mild negative correlation between the proportion of Immigrants from Micronesia and percentage of population with at least doctorate degree education in the United States with a correlation coefficient (R) of -0.316 and weighted average of 1.3%, a difference of 46.4%.
Doctorate Degree Correlation Summary
| Measurement | Swiss | Immigrants from Micronesia |
| Minimum | 0.21% | 0.19% |
| Maximum | 6.1% | 2.8% |
| Range | 5.9% | 2.6% |
| Mean | 1.6% | 1.1% |
| Median | 1.3% | 0.93% |
| Interquartile 25% (IQ1) | 0.84% | 0.49% |
| Interquartile 75% (IQ3) | 1.9% | 1.7% |
| Interquartile Range (IQR) | 1.1% | 1.2% |
| Standard Deviation (Sample) | 1.2% | 0.69% |
| Standard Deviation (Population) | 1.2% | 0.68% |
Similar Demographics by Doctorate Degree
Demographics Similar to Swiss by Doctorate Degree
In terms of doctorate degree, the demographic groups most similar to Swiss are South American Indian (2.0%, a difference of 0.090%), Swedish (2.0%, a difference of 0.10%), Afghan (2.0%, a difference of 0.23%), Serbian (2.0%, a difference of 0.24%), and Immigrants from Cameroon (2.0%, a difference of 0.30%).
| Demographics | Rating | Rank | Doctorate Degree |
| Immigrants | Sierra Leone | 90.2 /100 | #131 | Exceptional 2.0% |
| Scottish | 89.4 /100 | #132 | Excellent 2.0% |
| Immigrants | Uzbekistan | 89.3 /100 | #133 | Excellent 2.0% |
| Immigrants | Cameroon | 88.9 /100 | #134 | Excellent 2.0% |
| Serbians | 88.7 /100 | #135 | Excellent 2.0% |
| Swedes | 88.3 /100 | #136 | Excellent 2.0% |
| South American Indians | 88.3 /100 | #137 | Excellent 2.0% |
| Swiss | 88.0 /100 | #138 | Excellent 2.0% |
| Afghans | 87.2 /100 | #139 | Excellent 2.0% |
| Immigrants | Africa | 87.0 /100 | #140 | Excellent 2.0% |
| Senegalese | 86.7 /100 | #141 | Excellent 2.0% |
| Italians | 86.0 /100 | #142 | Excellent 2.0% |
| Sierra Leoneans | 85.1 /100 | #143 | Excellent 2.0% |
| Immigrants | Moldova | 84.3 /100 | #144 | Excellent 2.0% |
| Kenyans | 83.6 /100 | #145 | Excellent 1.9% |
Demographics Similar to Immigrants from Micronesia by Doctorate Degree
In terms of doctorate degree, the demographic groups most similar to Immigrants from Micronesia are Creek (1.3%, a difference of 0.050%), Navajo (1.4%, a difference of 0.25%), Immigrants from the Azores (1.4%, a difference of 0.45%), Dominican (1.4%, a difference of 0.48%), and Menominee (1.4%, a difference of 0.55%).
| Demographics | Rating | Rank | Doctorate Degree |
| Immigrants | Jamaica | 0.1 /100 | #310 | Tragic 1.4% |
| Immigrants | Honduras | 0.1 /100 | #311 | Tragic 1.4% |
| Immigrants | Nicaragua | 0.1 /100 | #312 | Tragic 1.4% |
| Menominee | 0.1 /100 | #313 | Tragic 1.4% |
| Dominicans | 0.1 /100 | #314 | Tragic 1.4% |
| Immigrants | Azores | 0.1 /100 | #315 | Tragic 1.4% |
| Navajo | 0.1 /100 | #316 | Tragic 1.4% |
| Immigrants | Micronesia | 0.1 /100 | #317 | Tragic 1.3% |
| Creek | 0.1 /100 | #318 | Tragic 1.3% |
| Immigrants | Guyana | 0.1 /100 | #319 | Tragic 1.3% |
| Immigrants | St. Vincent and the Grenadines | 0.1 /100 | #320 | Tragic 1.3% |
| Dutch West Indians | 0.1 /100 | #321 | Tragic 1.3% |
| Seminole | 0.1 /100 | #322 | Tragic 1.3% |
| Immigrants | Belize | 0.1 /100 | #323 | Tragic 1.3% |
| Natives/Alaskans | 0.0 /100 | #324 | Tragic 1.3% |