Immigrants from Ukraine vs Immigrants from Micronesia Vision Disability
COMPARE
Immigrants from Ukraine
Immigrants from Micronesia
Vision Disability
Vision Disability Comparison
Immigrants from Ukraine
Immigrants from Micronesia
2.1%
VISION DISABILITY
90.4/ 100
METRIC RATING
122nd/ 347
METRIC RANK
2.4%
VISION DISABILITY
0.3/ 100
METRIC RATING
252nd/ 347
METRIC RANK
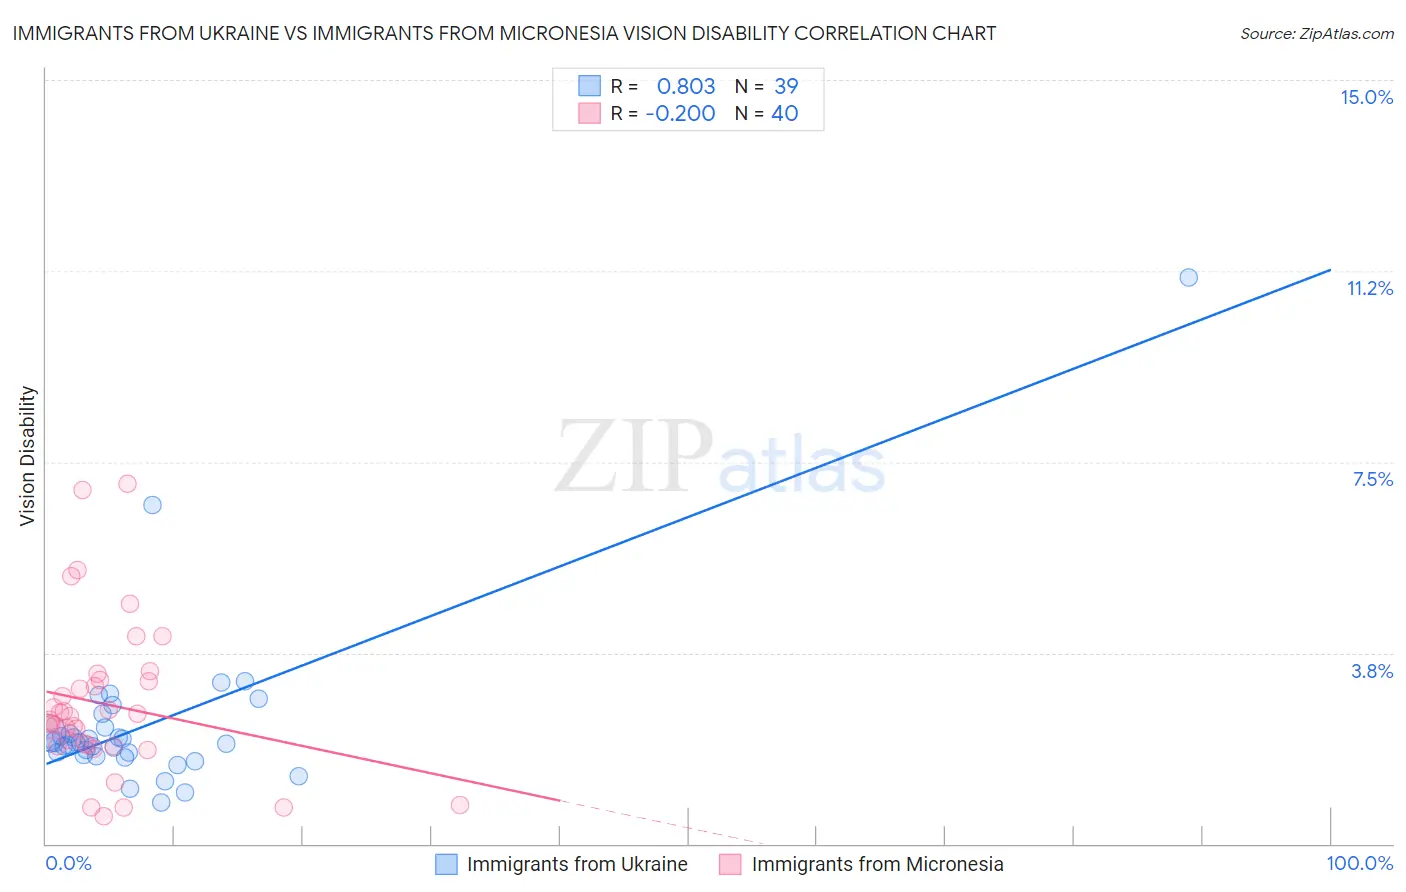
Immigrants from Ukraine vs Immigrants from Micronesia Vision Disability Correlation Chart
The statistical analysis conducted on geographies consisting of 289,545,992 people shows a very strong positive correlation between the proportion of Immigrants from Ukraine and percentage of population with vision disability in the United States with a correlation coefficient (R) of 0.803 and weighted average of 2.1%. Similarly, the statistical analysis conducted on geographies consisting of 61,592,184 people shows a weak negative correlation between the proportion of Immigrants from Micronesia and percentage of population with vision disability in the United States with a correlation coefficient (R) of -0.200 and weighted average of 2.4%, a difference of 12.9%.
Vision Disability Correlation Summary
| Measurement | Immigrants from Ukraine | Immigrants from Micronesia |
| Minimum | 0.80% | 0.53% |
| Maximum | 11.1% | 7.1% |
| Range | 10.3% | 6.5% |
| Mean | 2.4% | 2.7% |
| Median | 2.0% | 2.5% |
| Interquartile 25% (IQ1) | 1.8% | 1.9% |
| Interquartile 75% (IQ3) | 2.3% | 3.2% |
| Interquartile Range (IQR) | 0.53% | 1.3% |
| Standard Deviation (Sample) | 1.7% | 1.5% |
| Standard Deviation (Population) | 1.7% | 1.5% |
Similar Demographics by Vision Disability
Demographics Similar to Immigrants from Ukraine by Vision Disability
In terms of vision disability, the demographic groups most similar to Immigrants from Ukraine are Immigrants from Albania (2.1%, a difference of 0.0%), Immigrants from Scotland (2.1%, a difference of 0.010%), Immigrants from Spain (2.1%, a difference of 0.11%), Immigrants from Venezuela (2.1%, a difference of 0.11%), and Immigrants from Zimbabwe (2.1%, a difference of 0.13%).
| Demographics | Rating | Rank | Vision Disability |
| Immigrants | Vietnam | 92.2 /100 | #115 | Exceptional 2.1% |
| Ugandans | 92.2 /100 | #116 | Exceptional 2.1% |
| Poles | 92.0 /100 | #117 | Exceptional 2.1% |
| Immigrants | Philippines | 91.4 /100 | #118 | Exceptional 2.1% |
| Immigrants | Uganda | 91.4 /100 | #119 | Exceptional 2.1% |
| Immigrants | Zimbabwe | 91.0 /100 | #120 | Exceptional 2.1% |
| Immigrants | Scotland | 90.4 /100 | #121 | Exceptional 2.1% |
| Immigrants | Ukraine | 90.4 /100 | #122 | Exceptional 2.1% |
| Immigrants | Albania | 90.4 /100 | #123 | Exceptional 2.1% |
| Immigrants | Spain | 89.8 /100 | #124 | Excellent 2.1% |
| Immigrants | Venezuela | 89.8 /100 | #125 | Excellent 2.1% |
| Immigrants | Peru | 89.5 /100 | #126 | Excellent 2.1% |
| Sudanese | 89.2 /100 | #127 | Excellent 2.1% |
| Immigrants | Chile | 89.0 /100 | #128 | Excellent 2.1% |
| Immigrants | Cameroon | 88.8 /100 | #129 | Excellent 2.1% |
Demographics Similar to Immigrants from Micronesia by Vision Disability
In terms of vision disability, the demographic groups most similar to Immigrants from Micronesia are Japanese (2.4%, a difference of 0.070%), Immigrants from Laos (2.4%, a difference of 0.32%), Haitian (2.4%, a difference of 0.35%), Immigrants from Guatemala (2.4%, a difference of 0.38%), and Bangladeshi (2.3%, a difference of 0.43%).
| Demographics | Rating | Rank | Vision Disability |
| Alsatians | 0.6 /100 | #245 | Tragic 2.3% |
| French | 0.5 /100 | #246 | Tragic 2.3% |
| Guatemalans | 0.5 /100 | #247 | Tragic 2.3% |
| Sub-Saharan Africans | 0.5 /100 | #248 | Tragic 2.3% |
| Liberians | 0.5 /100 | #249 | Tragic 2.3% |
| Bangladeshis | 0.5 /100 | #250 | Tragic 2.3% |
| Immigrants | Laos | 0.4 /100 | #251 | Tragic 2.4% |
| Immigrants | Micronesia | 0.3 /100 | #252 | Tragic 2.4% |
| Japanese | 0.3 /100 | #253 | Tragic 2.4% |
| Haitians | 0.3 /100 | #254 | Tragic 2.4% |
| Immigrants | Guatemala | 0.3 /100 | #255 | Tragic 2.4% |
| Immigrants | Haiti | 0.2 /100 | #256 | Tragic 2.4% |
| West Indians | 0.2 /100 | #257 | Tragic 2.4% |
| British West Indians | 0.2 /100 | #258 | Tragic 2.4% |
| Whites/Caucasians | 0.2 /100 | #259 | Tragic 2.4% |