Swiss vs Immigrants from Micronesia Divorced or Separated
COMPARE
Swiss
Immigrants from Micronesia
Divorced or Separated
Divorced or Separated Comparison
Swiss
Immigrants from Micronesia
12.0%
DIVORCED OR SEPARATED
63.6/ 100
METRIC RATING
164th/ 347
METRIC RANK
12.7%
DIVORCED OR SEPARATED
0.3/ 100
METRIC RATING
273rd/ 347
METRIC RANK
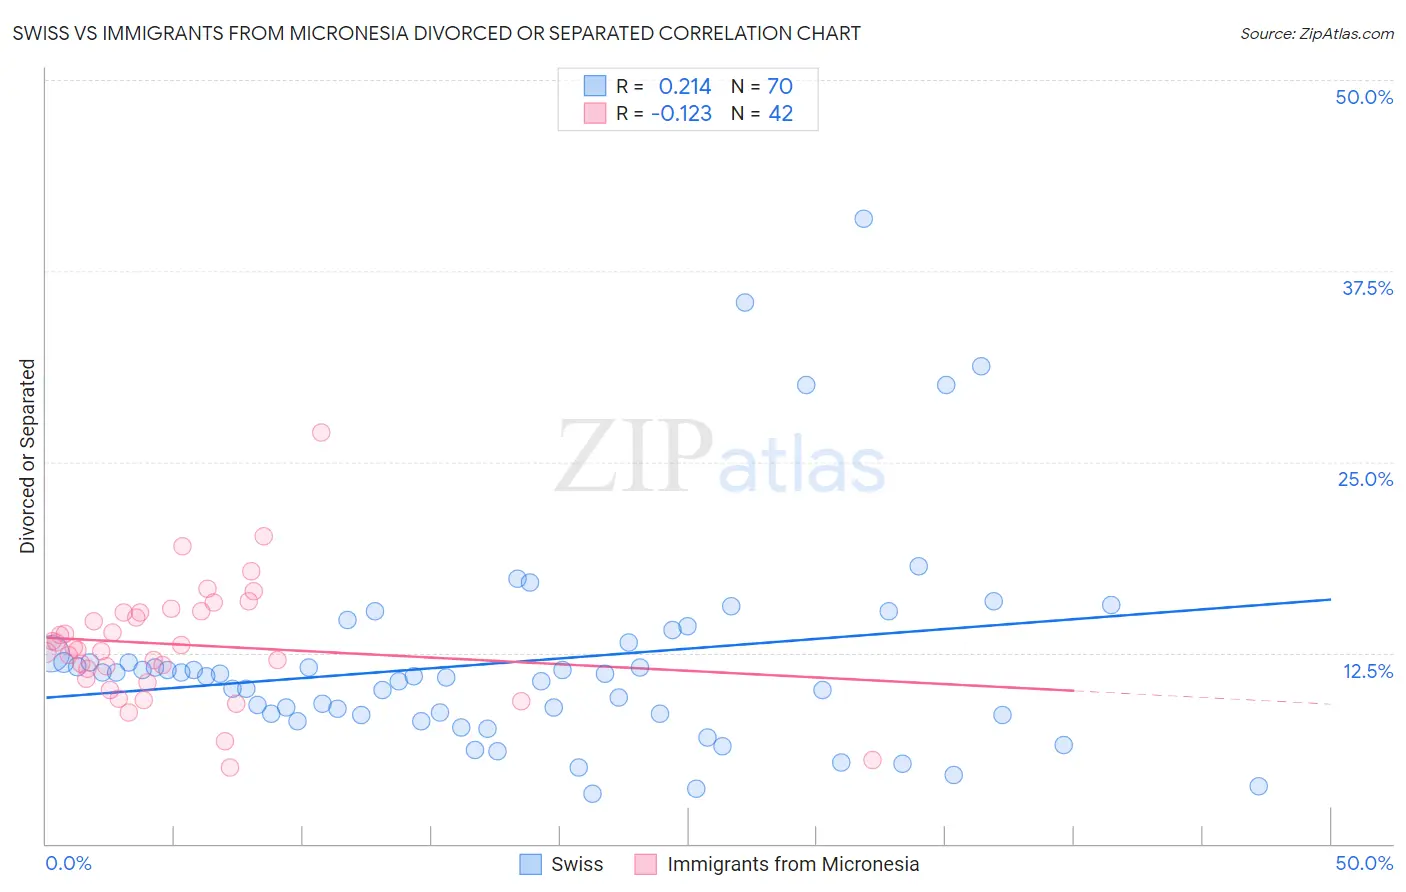
Swiss vs Immigrants from Micronesia Divorced or Separated Correlation Chart
The statistical analysis conducted on geographies consisting of 464,828,209 people shows a weak positive correlation between the proportion of Swiss and percentage of population currently divorced or separated in the United States with a correlation coefficient (R) of 0.214 and weighted average of 12.0%. Similarly, the statistical analysis conducted on geographies consisting of 61,605,566 people shows a poor negative correlation between the proportion of Immigrants from Micronesia and percentage of population currently divorced or separated in the United States with a correlation coefficient (R) of -0.123 and weighted average of 12.7%, a difference of 5.6%.
Divorced or Separated Correlation Summary
| Measurement | Swiss | Immigrants from Micronesia |
| Minimum | 3.3% | 5.0% |
| Maximum | 40.9% | 26.9% |
| Range | 37.6% | 21.9% |
| Mean | 11.9% | 13.1% |
| Median | 11.0% | 12.8% |
| Interquartile 25% (IQ1) | 8.5% | 10.8% |
| Interquartile 75% (IQ3) | 12.4% | 15.1% |
| Interquartile Range (IQR) | 4.0% | 4.3% |
| Standard Deviation (Sample) | 7.0% | 4.0% |
| Standard Deviation (Population) | 6.9% | 3.9% |
Similar Demographics by Divorced or Separated
Demographics Similar to Swiss by Divorced or Separated
In terms of divorced or separated, the demographic groups most similar to Swiss are Navajo (12.0%, a difference of 0.010%), Samoan (12.0%, a difference of 0.020%), Marshallese (12.0%, a difference of 0.040%), German Russian (12.0%, a difference of 0.070%), and Immigrants from Scotland (12.0%, a difference of 0.080%).
| Demographics | Rating | Rank | Divorced or Separated |
| Immigrants | Brazil | 68.8 /100 | #157 | Good 12.0% |
| Icelanders | 66.0 /100 | #158 | Good 12.0% |
| Immigrants | Barbados | 66.0 /100 | #159 | Good 12.0% |
| Immigrants | Scotland | 65.8 /100 | #160 | Good 12.0% |
| Marshallese | 64.6 /100 | #161 | Good 12.0% |
| Samoans | 64.3 /100 | #162 | Good 12.0% |
| Navajo | 63.9 /100 | #163 | Good 12.0% |
| Swiss | 63.6 /100 | #164 | Good 12.0% |
| German Russians | 61.8 /100 | #165 | Good 12.0% |
| Tohono O'odham | 60.4 /100 | #166 | Good 12.0% |
| Ethiopians | 58.5 /100 | #167 | Average 12.0% |
| Serbians | 57.1 /100 | #168 | Average 12.0% |
| Immigrants | Peru | 57.0 /100 | #169 | Average 12.0% |
| Mexican American Indians | 55.8 /100 | #170 | Average 12.0% |
| Costa Ricans | 53.3 /100 | #171 | Average 12.0% |
Demographics Similar to Immigrants from Micronesia by Divorced or Separated
In terms of divorced or separated, the demographic groups most similar to Immigrants from Micronesia are Bermudan (12.7%, a difference of 0.010%), Central American Indian (12.7%, a difference of 0.040%), Spaniard (12.7%, a difference of 0.10%), Immigrants from Middle Africa (12.7%, a difference of 0.12%), and Dominican (12.7%, a difference of 0.15%).
| Demographics | Rating | Rank | Divorced or Separated |
| Whites/Caucasians | 0.5 /100 | #266 | Tragic 12.6% |
| Scottish | 0.4 /100 | #267 | Tragic 12.6% |
| Fijians | 0.4 /100 | #268 | Tragic 12.6% |
| Immigrants | Liberia | 0.4 /100 | #269 | Tragic 12.6% |
| Ute | 0.4 /100 | #270 | Tragic 12.6% |
| Panamanians | 0.3 /100 | #271 | Tragic 12.7% |
| Immigrants | Middle Africa | 0.3 /100 | #272 | Tragic 12.7% |
| Immigrants | Micronesia | 0.3 /100 | #273 | Tragic 12.7% |
| Bermudans | 0.3 /100 | #274 | Tragic 12.7% |
| Central American Indians | 0.3 /100 | #275 | Tragic 12.7% |
| Spaniards | 0.2 /100 | #276 | Tragic 12.7% |
| Dominicans | 0.2 /100 | #277 | Tragic 12.7% |
| Lumbee | 0.2 /100 | #278 | Tragic 12.7% |
| Immigrants | Dominican Republic | 0.2 /100 | #279 | Tragic 12.7% |
| Immigrants | Zaire | 0.2 /100 | #280 | Tragic 12.7% |