Nepalese vs Immigrants from Micronesia Vision Disability
COMPARE
Nepalese
Immigrants from Micronesia
Vision Disability
Vision Disability Comparison
Nepalese
Immigrants from Micronesia
2.4%
VISION DISABILITY
0.0/ 100
METRIC RATING
279th/ 347
METRIC RANK
2.4%
VISION DISABILITY
0.3/ 100
METRIC RATING
252nd/ 347
METRIC RANK
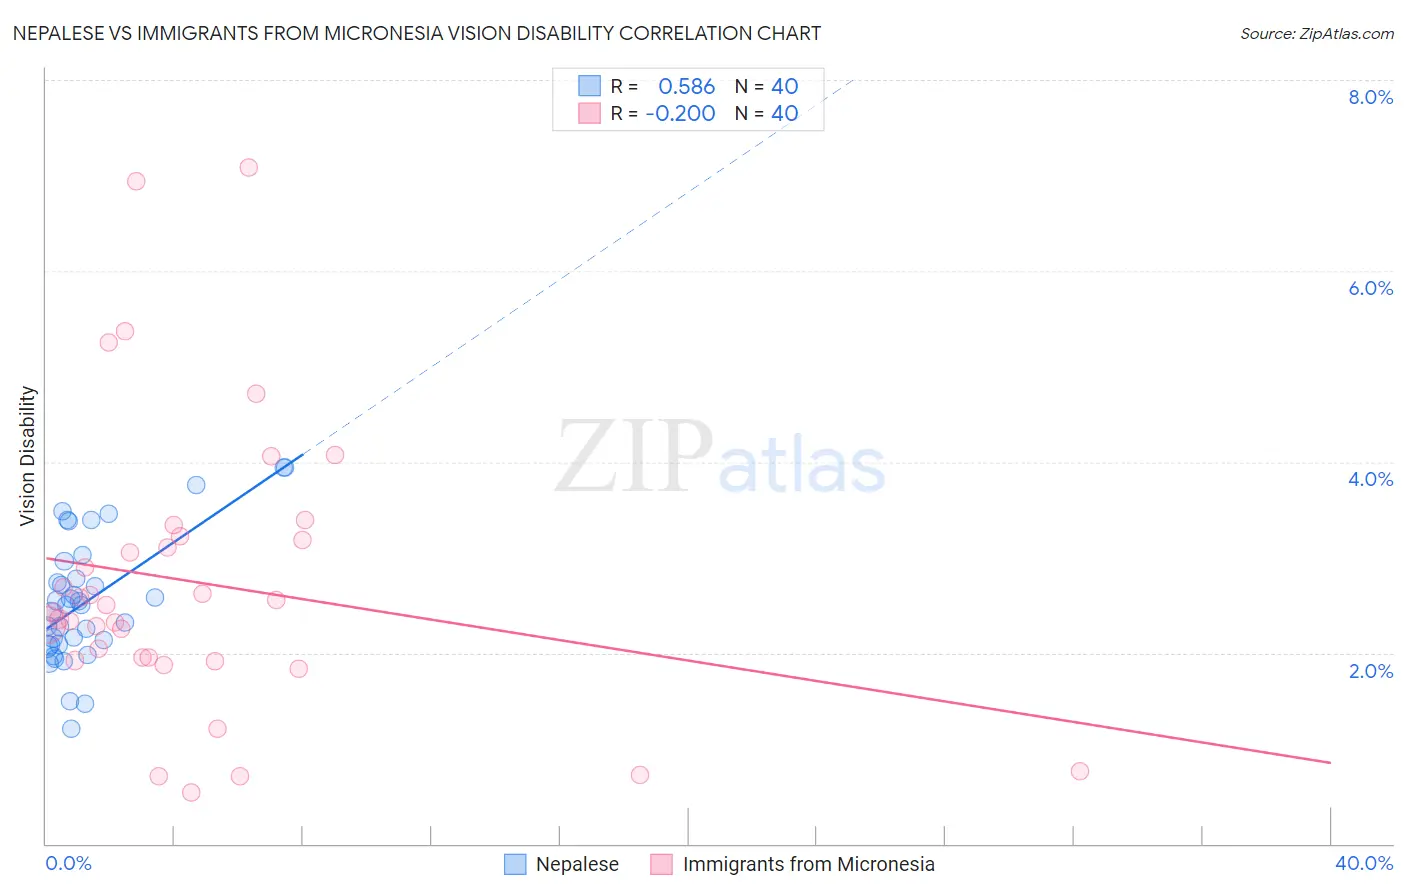
Nepalese vs Immigrants from Micronesia Vision Disability Correlation Chart
The statistical analysis conducted on geographies consisting of 24,521,755 people shows a substantial positive correlation between the proportion of Nepalese and percentage of population with vision disability in the United States with a correlation coefficient (R) of 0.586 and weighted average of 2.4%. Similarly, the statistical analysis conducted on geographies consisting of 61,592,184 people shows a weak negative correlation between the proportion of Immigrants from Micronesia and percentage of population with vision disability in the United States with a correlation coefficient (R) of -0.200 and weighted average of 2.4%, a difference of 3.6%.
Vision Disability Correlation Summary
| Measurement | Nepalese | Immigrants from Micronesia |
| Minimum | 1.2% | 0.53% |
| Maximum | 3.9% | 7.1% |
| Range | 2.7% | 6.5% |
| Mean | 2.5% | 2.7% |
| Median | 2.5% | 2.5% |
| Interquartile 25% (IQ1) | 2.1% | 1.9% |
| Interquartile 75% (IQ3) | 2.9% | 3.2% |
| Interquartile Range (IQR) | 0.78% | 1.3% |
| Standard Deviation (Sample) | 0.66% | 1.5% |
| Standard Deviation (Population) | 0.65% | 1.5% |
Similar Demographics by Vision Disability
Demographics Similar to Nepalese by Vision Disability
In terms of vision disability, the demographic groups most similar to Nepalese are Spanish (2.4%, a difference of 0.010%), Cape Verdean (2.4%, a difference of 0.040%), Bahamian (2.4%, a difference of 0.17%), Scotch-Irish (2.4%, a difference of 0.21%), and U.S. Virgin Islander (2.5%, a difference of 0.27%).
| Demographics | Rating | Rank | Vision Disability |
| Spaniards | 0.1 /100 | #272 | Tragic 2.4% |
| Immigrants | Bahamas | 0.1 /100 | #273 | Tragic 2.4% |
| Immigrants | Latin America | 0.0 /100 | #274 | Tragic 2.4% |
| Chippewa | 0.0 /100 | #275 | Tragic 2.4% |
| Scotch-Irish | 0.0 /100 | #276 | Tragic 2.4% |
| Bahamians | 0.0 /100 | #277 | Tragic 2.4% |
| Spanish | 0.0 /100 | #278 | Tragic 2.4% |
| Nepalese | 0.0 /100 | #279 | Tragic 2.4% |
| Cape Verdeans | 0.0 /100 | #280 | Tragic 2.4% |
| U.S. Virgin Islanders | 0.0 /100 | #281 | Tragic 2.5% |
| Immigrants | Caribbean | 0.0 /100 | #282 | Tragic 2.5% |
| Puget Sound Salish | 0.0 /100 | #283 | Tragic 2.5% |
| Yakama | 0.0 /100 | #284 | Tragic 2.5% |
| Immigrants | Central America | 0.0 /100 | #285 | Tragic 2.5% |
| Sioux | 0.0 /100 | #286 | Tragic 2.5% |
Demographics Similar to Immigrants from Micronesia by Vision Disability
In terms of vision disability, the demographic groups most similar to Immigrants from Micronesia are Japanese (2.4%, a difference of 0.070%), Immigrants from Laos (2.4%, a difference of 0.32%), Haitian (2.4%, a difference of 0.35%), Immigrants from Guatemala (2.4%, a difference of 0.38%), and Bangladeshi (2.3%, a difference of 0.43%).
| Demographics | Rating | Rank | Vision Disability |
| Alsatians | 0.6 /100 | #245 | Tragic 2.3% |
| French | 0.5 /100 | #246 | Tragic 2.3% |
| Guatemalans | 0.5 /100 | #247 | Tragic 2.3% |
| Sub-Saharan Africans | 0.5 /100 | #248 | Tragic 2.3% |
| Liberians | 0.5 /100 | #249 | Tragic 2.3% |
| Bangladeshis | 0.5 /100 | #250 | Tragic 2.3% |
| Immigrants | Laos | 0.4 /100 | #251 | Tragic 2.4% |
| Immigrants | Micronesia | 0.3 /100 | #252 | Tragic 2.4% |
| Japanese | 0.3 /100 | #253 | Tragic 2.4% |
| Haitians | 0.3 /100 | #254 | Tragic 2.4% |
| Immigrants | Guatemala | 0.3 /100 | #255 | Tragic 2.4% |
| Immigrants | Haiti | 0.2 /100 | #256 | Tragic 2.4% |
| West Indians | 0.2 /100 | #257 | Tragic 2.4% |
| British West Indians | 0.2 /100 | #258 | Tragic 2.4% |
| Whites/Caucasians | 0.2 /100 | #259 | Tragic 2.4% |