Swiss vs Immigrants from Moldova Vision Disability
COMPARE
Swiss
Immigrants from Moldova
Vision Disability
Vision Disability Comparison
Swiss
Immigrants from Moldova
2.2%
VISION DISABILITY
55.7/ 100
METRIC RATING
170th/ 347
METRIC RANK
2.0%
VISION DISABILITY
97.2/ 100
METRIC RATING
86th/ 347
METRIC RANK
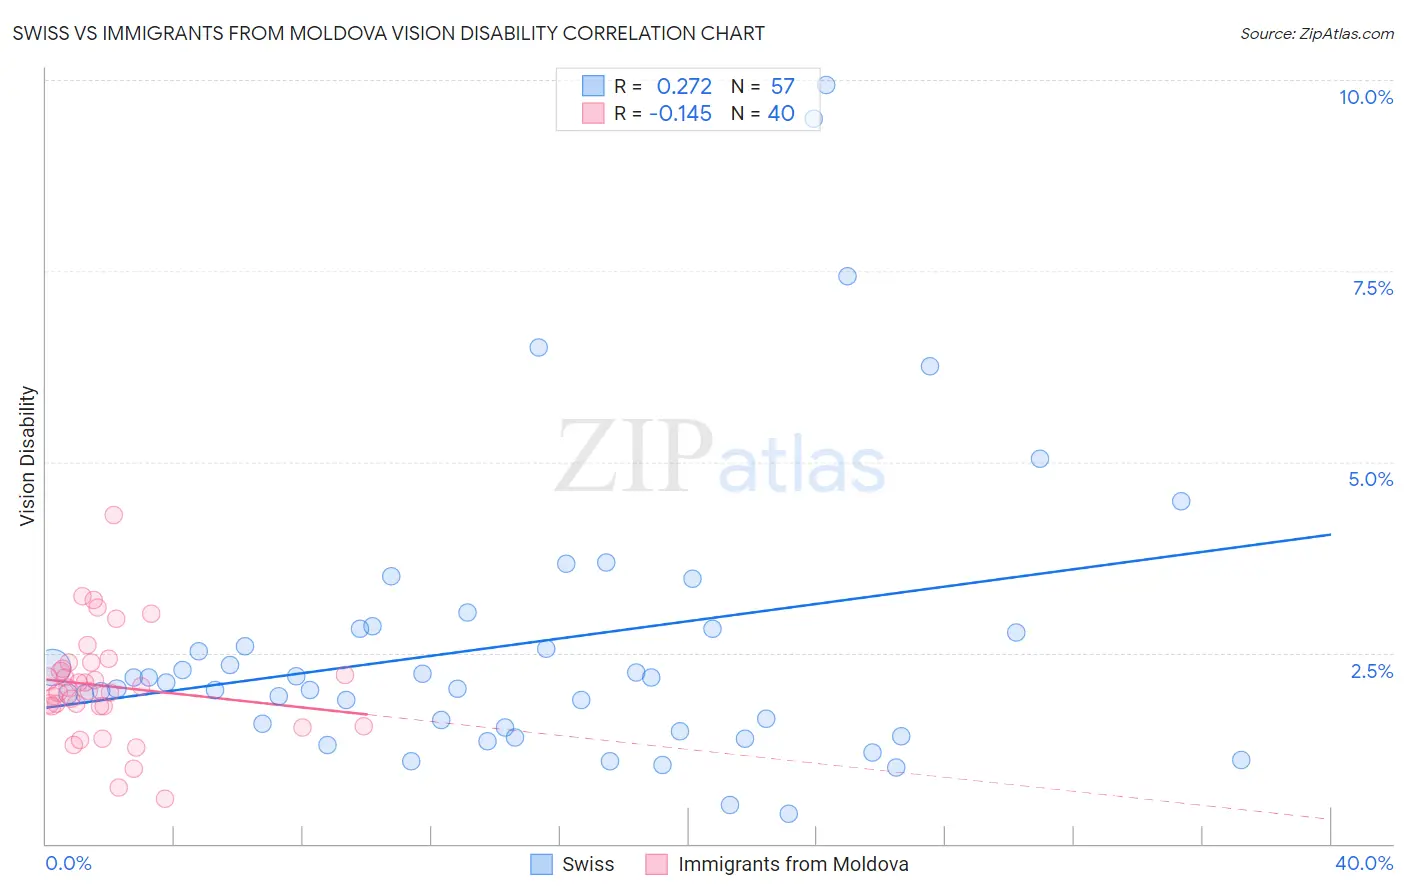
Swiss vs Immigrants from Moldova Vision Disability Correlation Chart
The statistical analysis conducted on geographies consisting of 464,374,244 people shows a weak positive correlation between the proportion of Swiss and percentage of population with vision disability in the United States with a correlation coefficient (R) of 0.272 and weighted average of 2.2%. Similarly, the statistical analysis conducted on geographies consisting of 124,355,490 people shows a poor negative correlation between the proportion of Immigrants from Moldova and percentage of population with vision disability in the United States with a correlation coefficient (R) of -0.145 and weighted average of 2.0%, a difference of 5.5%.
Vision Disability Correlation Summary
| Measurement | Swiss | Immigrants from Moldova |
| Minimum | 0.39% | 0.59% |
| Maximum | 9.9% | 4.3% |
| Range | 9.6% | 3.7% |
| Mean | 2.6% | 2.1% |
| Median | 2.1% | 2.0% |
| Interquartile 25% (IQ1) | 1.5% | 1.8% |
| Interquartile 75% (IQ3) | 2.8% | 2.3% |
| Interquartile Range (IQR) | 1.3% | 0.53% |
| Standard Deviation (Sample) | 1.9% | 0.71% |
| Standard Deviation (Population) | 1.9% | 0.70% |
Similar Demographics by Vision Disability
Demographics Similar to Swiss by Vision Disability
In terms of vision disability, the demographic groups most similar to Swiss are Lebanese (2.2%, a difference of 0.090%), South American Indian (2.2%, a difference of 0.11%), Northern European (2.2%, a difference of 0.36%), Scandinavian (2.2%, a difference of 0.36%), and Immigrants from Canada (2.2%, a difference of 0.36%).
| Demographics | Rating | Rank | Vision Disability |
| Icelanders | 66.1 /100 | #163 | Good 2.1% |
| Immigrants | Bangladesh | 65.5 /100 | #164 | Good 2.1% |
| Immigrants | Iraq | 64.8 /100 | #165 | Good 2.1% |
| Immigrants | England | 62.8 /100 | #166 | Good 2.1% |
| Immigrants | Africa | 62.6 /100 | #167 | Good 2.1% |
| Brazilians | 62.2 /100 | #168 | Good 2.1% |
| South American Indians | 57.4 /100 | #169 | Average 2.2% |
| Swiss | 55.7 /100 | #170 | Average 2.2% |
| Lebanese | 54.3 /100 | #171 | Average 2.2% |
| Northern Europeans | 50.1 /100 | #172 | Average 2.2% |
| Scandinavians | 50.0 /100 | #173 | Average 2.2% |
| Immigrants | Canada | 50.0 /100 | #174 | Average 2.2% |
| Immigrants | Fiji | 47.6 /100 | #175 | Average 2.2% |
| Yugoslavians | 46.5 /100 | #176 | Average 2.2% |
| Slavs | 46.0 /100 | #177 | Average 2.2% |
Demographics Similar to Immigrants from Moldova by Vision Disability
In terms of vision disability, the demographic groups most similar to Immigrants from Moldova are Chinese (2.0%, a difference of 0.020%), Immigrants from Switzerland (2.0%, a difference of 0.060%), Norwegian (2.0%, a difference of 0.070%), Immigrants from Latvia (2.0%, a difference of 0.080%), and Immigrants from Eastern Africa (2.0%, a difference of 0.11%).
| Demographics | Rating | Rank | Vision Disability |
| Assyrians/Chaldeans/Syriacs | 98.1 /100 | #79 | Exceptional 2.0% |
| Lithuanians | 97.7 /100 | #80 | Exceptional 2.0% |
| Soviet Union | 97.6 /100 | #81 | Exceptional 2.0% |
| Immigrants | Poland | 97.6 /100 | #82 | Exceptional 2.0% |
| Immigrants | Western Asia | 97.5 /100 | #83 | Exceptional 2.0% |
| Immigrants | Latvia | 97.3 /100 | #84 | Exceptional 2.0% |
| Chinese | 97.2 /100 | #85 | Exceptional 2.0% |
| Immigrants | Moldova | 97.2 /100 | #86 | Exceptional 2.0% |
| Immigrants | Switzerland | 97.0 /100 | #87 | Exceptional 2.0% |
| Norwegians | 97.0 /100 | #88 | Exceptional 2.0% |
| Immigrants | Eastern Africa | 97.0 /100 | #89 | Exceptional 2.0% |
| Immigrants | Lebanon | 96.7 /100 | #90 | Exceptional 2.1% |
| Immigrants | Somalia | 96.2 /100 | #91 | Exceptional 2.1% |
| Immigrants | Syria | 96.2 /100 | #92 | Exceptional 2.1% |
| Immigrants | Europe | 96.1 /100 | #93 | Exceptional 2.1% |