Swiss vs Immigrants from Sri Lanka Vision Disability
COMPARE
Swiss
Immigrants from Sri Lanka
Vision Disability
Vision Disability Comparison
Swiss
Immigrants from Sri Lanka
2.2%
VISION DISABILITY
55.7/ 100
METRIC RATING
170th/ 347
METRIC RANK
1.9%
VISION DISABILITY
100.0/ 100
METRIC RATING
19th/ 347
METRIC RANK
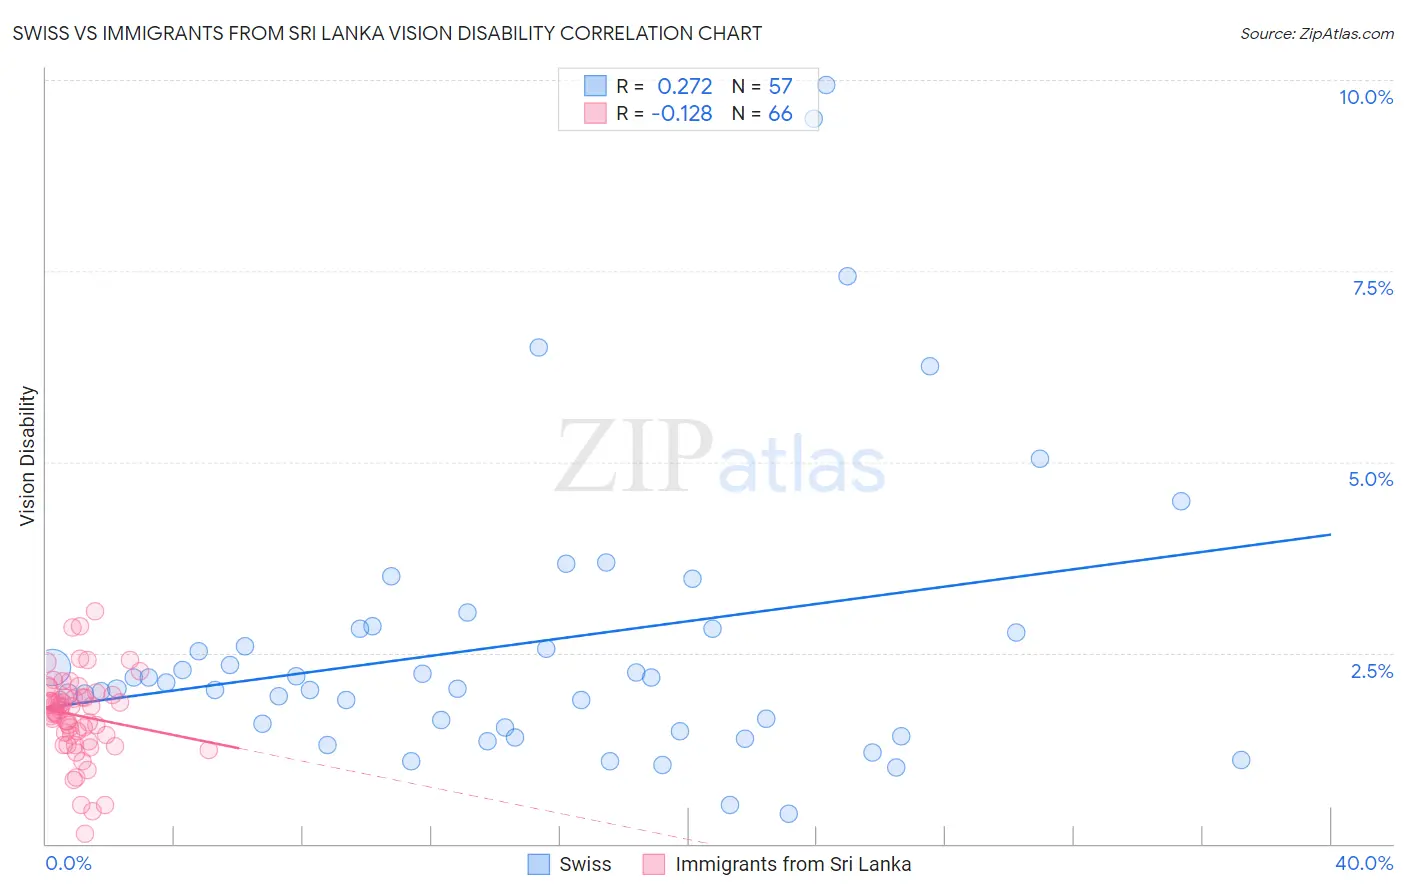
Swiss vs Immigrants from Sri Lanka Vision Disability Correlation Chart
The statistical analysis conducted on geographies consisting of 464,374,244 people shows a weak positive correlation between the proportion of Swiss and percentage of population with vision disability in the United States with a correlation coefficient (R) of 0.272 and weighted average of 2.2%. Similarly, the statistical analysis conducted on geographies consisting of 149,673,747 people shows a poor negative correlation between the proportion of Immigrants from Sri Lanka and percentage of population with vision disability in the United States with a correlation coefficient (R) of -0.128 and weighted average of 1.9%, a difference of 14.8%.
Vision Disability Correlation Summary
| Measurement | Swiss | Immigrants from Sri Lanka |
| Minimum | 0.39% | 0.13% |
| Maximum | 9.9% | 3.0% |
| Range | 9.6% | 2.9% |
| Mean | 2.6% | 1.7% |
| Median | 2.1% | 1.7% |
| Interquartile 25% (IQ1) | 1.5% | 1.4% |
| Interquartile 75% (IQ3) | 2.8% | 1.9% |
| Interquartile Range (IQR) | 1.3% | 0.50% |
| Standard Deviation (Sample) | 1.9% | 0.55% |
| Standard Deviation (Population) | 1.9% | 0.54% |
Similar Demographics by Vision Disability
Demographics Similar to Swiss by Vision Disability
In terms of vision disability, the demographic groups most similar to Swiss are Lebanese (2.2%, a difference of 0.090%), South American Indian (2.2%, a difference of 0.11%), Northern European (2.2%, a difference of 0.36%), Scandinavian (2.2%, a difference of 0.36%), and Immigrants from Canada (2.2%, a difference of 0.36%).
| Demographics | Rating | Rank | Vision Disability |
| Icelanders | 66.1 /100 | #163 | Good 2.1% |
| Immigrants | Bangladesh | 65.5 /100 | #164 | Good 2.1% |
| Immigrants | Iraq | 64.8 /100 | #165 | Good 2.1% |
| Immigrants | England | 62.8 /100 | #166 | Good 2.1% |
| Immigrants | Africa | 62.6 /100 | #167 | Good 2.1% |
| Brazilians | 62.2 /100 | #168 | Good 2.1% |
| South American Indians | 57.4 /100 | #169 | Average 2.2% |
| Swiss | 55.7 /100 | #170 | Average 2.2% |
| Lebanese | 54.3 /100 | #171 | Average 2.2% |
| Northern Europeans | 50.1 /100 | #172 | Average 2.2% |
| Scandinavians | 50.0 /100 | #173 | Average 2.2% |
| Immigrants | Canada | 50.0 /100 | #174 | Average 2.2% |
| Immigrants | Fiji | 47.6 /100 | #175 | Average 2.2% |
| Yugoslavians | 46.5 /100 | #176 | Average 2.2% |
| Slavs | 46.0 /100 | #177 | Average 2.2% |
Demographics Similar to Immigrants from Sri Lanka by Vision Disability
In terms of vision disability, the demographic groups most similar to Immigrants from Sri Lanka are Asian (1.9%, a difference of 1.1%), Bolivian (1.9%, a difference of 1.2%), Turkish (1.9%, a difference of 1.4%), Immigrants from Pakistan (1.9%, a difference of 1.4%), and Indian (Asian) (1.8%, a difference of 1.7%).
| Demographics | Rating | Rank | Vision Disability |
| Immigrants | Korea | 100.0 /100 | #12 | Exceptional 1.8% |
| Immigrants | Eastern Asia | 100.0 /100 | #13 | Exceptional 1.8% |
| Immigrants | China | 100.0 /100 | #14 | Exceptional 1.8% |
| Immigrants | Bolivia | 100.0 /100 | #15 | Exceptional 1.8% |
| Indians (Asian) | 100.0 /100 | #16 | Exceptional 1.8% |
| Burmese | 100.0 /100 | #17 | Exceptional 1.8% |
| Bolivians | 100.0 /100 | #18 | Exceptional 1.9% |
| Immigrants | Sri Lanka | 100.0 /100 | #19 | Exceptional 1.9% |
| Asians | 100.0 /100 | #20 | Exceptional 1.9% |
| Turks | 100.0 /100 | #21 | Exceptional 1.9% |
| Immigrants | Pakistan | 100.0 /100 | #22 | Exceptional 1.9% |
| Immigrants | Asia | 99.9 /100 | #23 | Exceptional 1.9% |
| Immigrants | Lithuania | 99.9 /100 | #24 | Exceptional 1.9% |
| Bulgarians | 99.9 /100 | #25 | Exceptional 1.9% |
| Immigrants | Japan | 99.9 /100 | #26 | Exceptional 1.9% |