Swiss vs Colombian Vision Disability
COMPARE
Swiss
Colombian
Vision Disability
Vision Disability Comparison
Swiss
Colombians
2.2%
VISION DISABILITY
55.7/ 100
METRIC RATING
170th/ 347
METRIC RANK
2.1%
VISION DISABILITY
76.2/ 100
METRIC RATING
149th/ 347
METRIC RANK
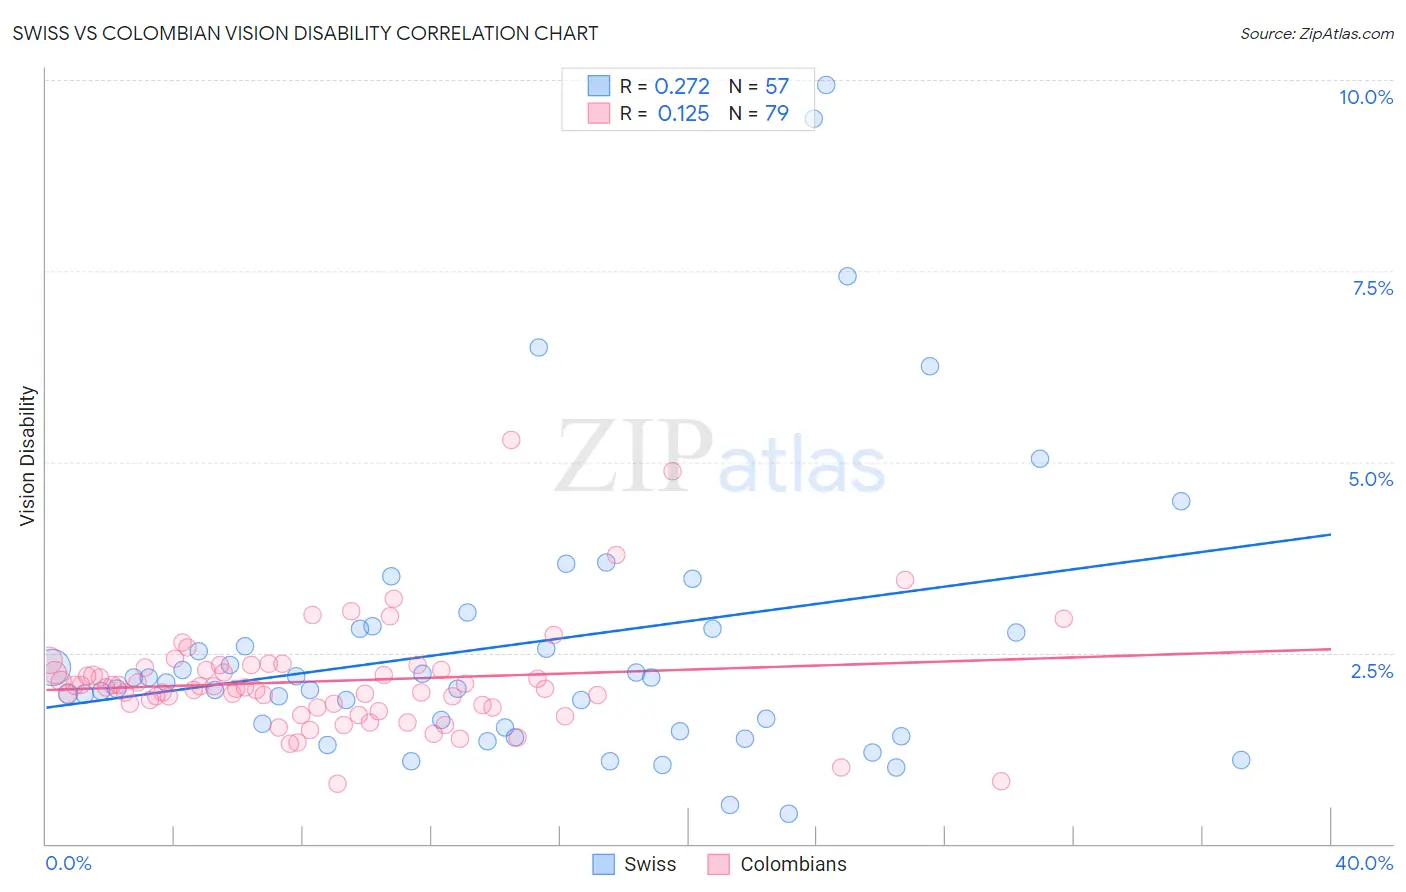
Swiss vs Colombian Vision Disability Correlation Chart
The statistical analysis conducted on geographies consisting of 464,374,244 people shows a weak positive correlation between the proportion of Swiss and percentage of population with vision disability in the United States with a correlation coefficient (R) of 0.272 and weighted average of 2.2%. Similarly, the statistical analysis conducted on geographies consisting of 419,253,931 people shows a poor positive correlation between the proportion of Colombians and percentage of population with vision disability in the United States with a correlation coefficient (R) of 0.125 and weighted average of 2.1%, a difference of 1.5%.
Vision Disability Correlation Summary
| Measurement | Swiss | Colombian |
| Minimum | 0.39% | 0.78% |
| Maximum | 9.9% | 5.3% |
| Range | 9.6% | 4.5% |
| Mean | 2.6% | 2.1% |
| Median | 2.1% | 2.0% |
| Interquartile 25% (IQ1) | 1.5% | 1.8% |
| Interquartile 75% (IQ3) | 2.8% | 2.3% |
| Interquartile Range (IQR) | 1.3% | 0.52% |
| Standard Deviation (Sample) | 1.9% | 0.71% |
| Standard Deviation (Population) | 1.9% | 0.70% |
Similar Demographics by Vision Disability
Demographics Similar to Swiss by Vision Disability
In terms of vision disability, the demographic groups most similar to Swiss are Lebanese (2.2%, a difference of 0.090%), South American Indian (2.2%, a difference of 0.11%), Northern European (2.2%, a difference of 0.36%), Scandinavian (2.2%, a difference of 0.36%), and Immigrants from Canada (2.2%, a difference of 0.36%).
| Demographics | Rating | Rank | Vision Disability |
| Icelanders | 66.1 /100 | #163 | Good 2.1% |
| Immigrants | Bangladesh | 65.5 /100 | #164 | Good 2.1% |
| Immigrants | Iraq | 64.8 /100 | #165 | Good 2.1% |
| Immigrants | England | 62.8 /100 | #166 | Good 2.1% |
| Immigrants | Africa | 62.6 /100 | #167 | Good 2.1% |
| Brazilians | 62.2 /100 | #168 | Good 2.1% |
| South American Indians | 57.4 /100 | #169 | Average 2.2% |
| Swiss | 55.7 /100 | #170 | Average 2.2% |
| Lebanese | 54.3 /100 | #171 | Average 2.2% |
| Northern Europeans | 50.1 /100 | #172 | Average 2.2% |
| Scandinavians | 50.0 /100 | #173 | Average 2.2% |
| Immigrants | Canada | 50.0 /100 | #174 | Average 2.2% |
| Immigrants | Fiji | 47.6 /100 | #175 | Average 2.2% |
| Yugoslavians | 46.5 /100 | #176 | Average 2.2% |
| Slavs | 46.0 /100 | #177 | Average 2.2% |
Demographics Similar to Colombians by Vision Disability
In terms of vision disability, the demographic groups most similar to Colombians are Belgian (2.1%, a difference of 0.030%), Immigrants from Norway (2.1%, a difference of 0.070%), Immigrants from Southern Europe (2.1%, a difference of 0.14%), Finnish (2.1%, a difference of 0.19%), and Immigrants from Sudan (2.1%, a difference of 0.20%).
| Demographics | Rating | Rank | Vision Disability |
| South Americans | 82.8 /100 | #142 | Excellent 2.1% |
| Immigrants | Sierra Leone | 82.8 /100 | #143 | Excellent 2.1% |
| Ukrainians | 81.9 /100 | #144 | Excellent 2.1% |
| Immigrants | Bosnia and Herzegovina | 81.5 /100 | #145 | Excellent 2.1% |
| Italians | 79.7 /100 | #146 | Good 2.1% |
| Immigrants | Sudan | 78.4 /100 | #147 | Good 2.1% |
| Finns | 78.3 /100 | #148 | Good 2.1% |
| Colombians | 76.2 /100 | #149 | Good 2.1% |
| Belgians | 75.9 /100 | #150 | Good 2.1% |
| Immigrants | Norway | 75.5 /100 | #151 | Good 2.1% |
| Immigrants | Southern Europe | 74.6 /100 | #152 | Good 2.1% |
| Immigrants | South America | 73.8 /100 | #153 | Good 2.1% |
| Slovenes | 73.6 /100 | #154 | Good 2.1% |
| Immigrants | Colombia | 72.1 /100 | #155 | Good 2.1% |
| Pakistanis | 71.6 /100 | #156 | Good 2.1% |