Dutch vs Immigrants from Bahamas Vision Disability
COMPARE
Dutch
Immigrants from Bahamas
Vision Disability
Vision Disability Comparison
Dutch
Immigrants from Bahamas
2.2%
VISION DISABILITY
17.1/ 100
METRIC RATING
203rd/ 347
METRIC RANK
2.4%
VISION DISABILITY
0.1/ 100
METRIC RATING
273rd/ 347
METRIC RANK
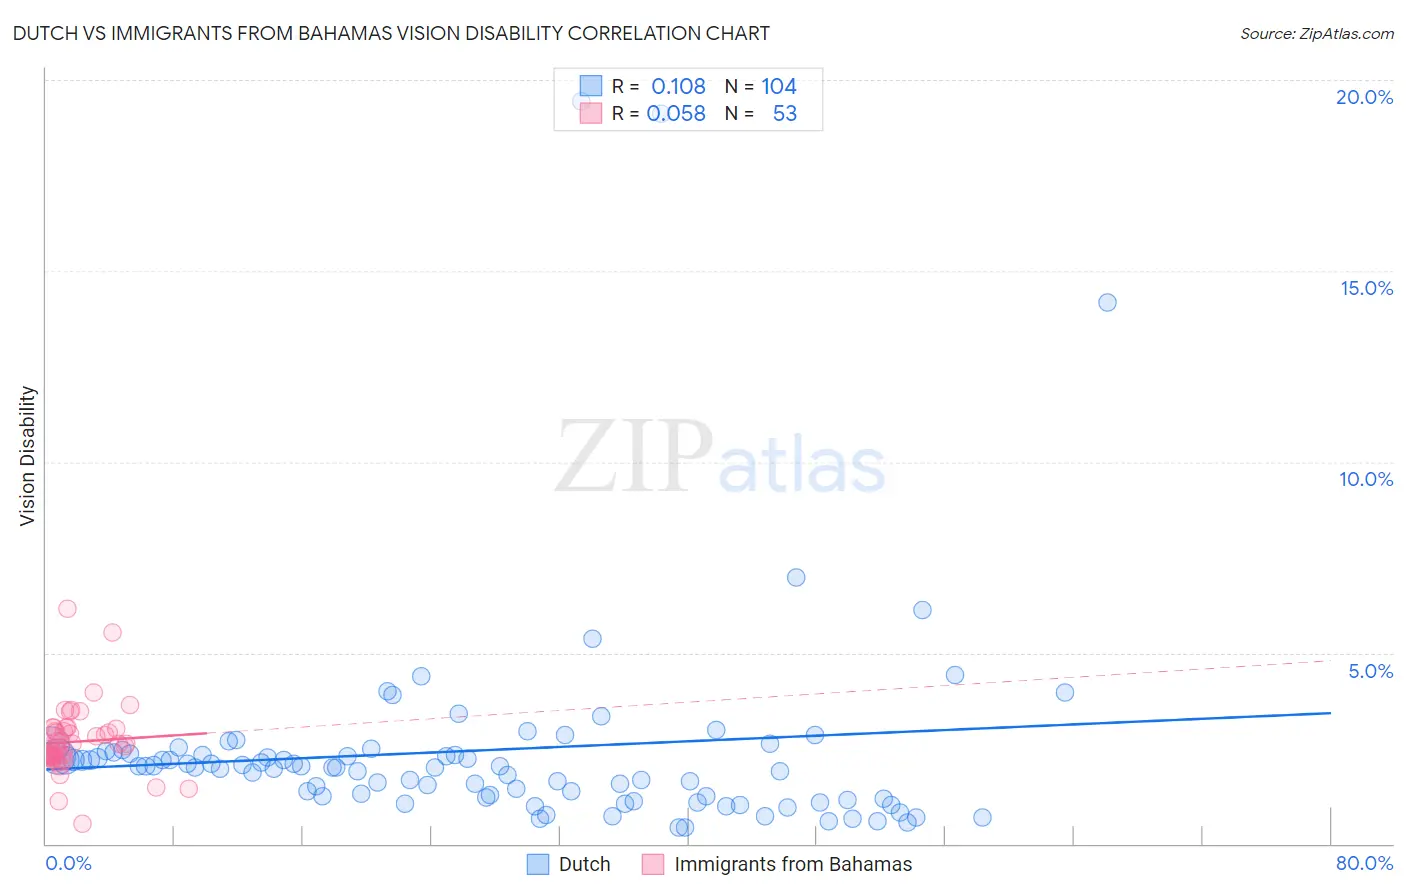
Dutch vs Immigrants from Bahamas Vision Disability Correlation Chart
The statistical analysis conducted on geographies consisting of 552,767,412 people shows a poor positive correlation between the proportion of Dutch and percentage of population with vision disability in the United States with a correlation coefficient (R) of 0.108 and weighted average of 2.2%. Similarly, the statistical analysis conducted on geographies consisting of 104,644,216 people shows a slight positive correlation between the proportion of Immigrants from Bahamas and percentage of population with vision disability in the United States with a correlation coefficient (R) of 0.058 and weighted average of 2.4%, a difference of 9.1%.
Vision Disability Correlation Summary
| Measurement | Dutch | Immigrants from Bahamas |
| Minimum | 0.42% | 0.51% |
| Maximum | 19.4% | 6.2% |
| Range | 19.0% | 5.7% |
| Mean | 2.4% | 2.7% |
| Median | 2.0% | 2.5% |
| Interquartile 25% (IQ1) | 1.2% | 2.3% |
| Interquartile 75% (IQ3) | 2.4% | 3.0% |
| Interquartile Range (IQR) | 1.2% | 0.70% |
| Standard Deviation (Sample) | 2.9% | 0.89% |
| Standard Deviation (Population) | 2.9% | 0.88% |
Similar Demographics by Vision Disability
Demographics Similar to Dutch by Vision Disability
In terms of vision disability, the demographic groups most similar to Dutch are Immigrants from Zaire (2.2%, a difference of 0.10%), Immigrants from Guyana (2.2%, a difference of 0.13%), Samoan (2.2%, a difference of 0.16%), Slovak (2.2%, a difference of 0.18%), and Pennsylvania German (2.2%, a difference of 0.30%).
| Demographics | Rating | Rank | Vision Disability |
| Immigrants | Grenada | 23.1 /100 | #196 | Fair 2.2% |
| Ghanaians | 21.8 /100 | #197 | Fair 2.2% |
| Czechoslovakians | 21.6 /100 | #198 | Fair 2.2% |
| Immigrants | El Salvador | 21.0 /100 | #199 | Fair 2.2% |
| Immigrants | Thailand | 20.1 /100 | #200 | Fair 2.2% |
| Slovaks | 18.8 /100 | #201 | Poor 2.2% |
| Immigrants | Zaire | 18.0 /100 | #202 | Poor 2.2% |
| Dutch | 17.1 /100 | #203 | Poor 2.2% |
| Immigrants | Guyana | 15.9 /100 | #204 | Poor 2.2% |
| Samoans | 15.7 /100 | #205 | Poor 2.2% |
| Pennsylvania Germans | 14.5 /100 | #206 | Poor 2.2% |
| Immigrants | Nigeria | 13.5 /100 | #207 | Poor 2.2% |
| Germans | 13.4 /100 | #208 | Poor 2.2% |
| Immigrants | Brazil | 13.1 /100 | #209 | Poor 2.2% |
| Immigrants | Uruguay | 11.5 /100 | #210 | Poor 2.2% |
Demographics Similar to Immigrants from Bahamas by Vision Disability
In terms of vision disability, the demographic groups most similar to Immigrants from Bahamas are Immigrants from Latin America (2.4%, a difference of 0.31%), Spaniard (2.4%, a difference of 0.33%), Immigrants from the Azores (2.4%, a difference of 0.43%), Cuban (2.4%, a difference of 0.59%), and Celtic (2.4%, a difference of 0.60%).
| Demographics | Rating | Rank | Vision Disability |
| Mexican American Indians | 0.1 /100 | #266 | Tragic 2.4% |
| Ute | 0.1 /100 | #267 | Tragic 2.4% |
| Senegalese | 0.1 /100 | #268 | Tragic 2.4% |
| Celtics | 0.1 /100 | #269 | Tragic 2.4% |
| Cubans | 0.1 /100 | #270 | Tragic 2.4% |
| Immigrants | Azores | 0.1 /100 | #271 | Tragic 2.4% |
| Spaniards | 0.1 /100 | #272 | Tragic 2.4% |
| Immigrants | Bahamas | 0.1 /100 | #273 | Tragic 2.4% |
| Immigrants | Latin America | 0.0 /100 | #274 | Tragic 2.4% |
| Chippewa | 0.0 /100 | #275 | Tragic 2.4% |
| Scotch-Irish | 0.0 /100 | #276 | Tragic 2.4% |
| Bahamians | 0.0 /100 | #277 | Tragic 2.4% |
| Spanish | 0.0 /100 | #278 | Tragic 2.4% |
| Nepalese | 0.0 /100 | #279 | Tragic 2.4% |
| Cape Verdeans | 0.0 /100 | #280 | Tragic 2.4% |