Nigerian vs Immigrants from Bahamas Vision Disability
COMPARE
Nigerian
Immigrants from Bahamas
Vision Disability
Vision Disability Comparison
Nigerians
Immigrants from Bahamas
2.3%
VISION DISABILITY
7.2/ 100
METRIC RATING
215th/ 347
METRIC RANK
2.4%
VISION DISABILITY
0.1/ 100
METRIC RATING
273rd/ 347
METRIC RANK
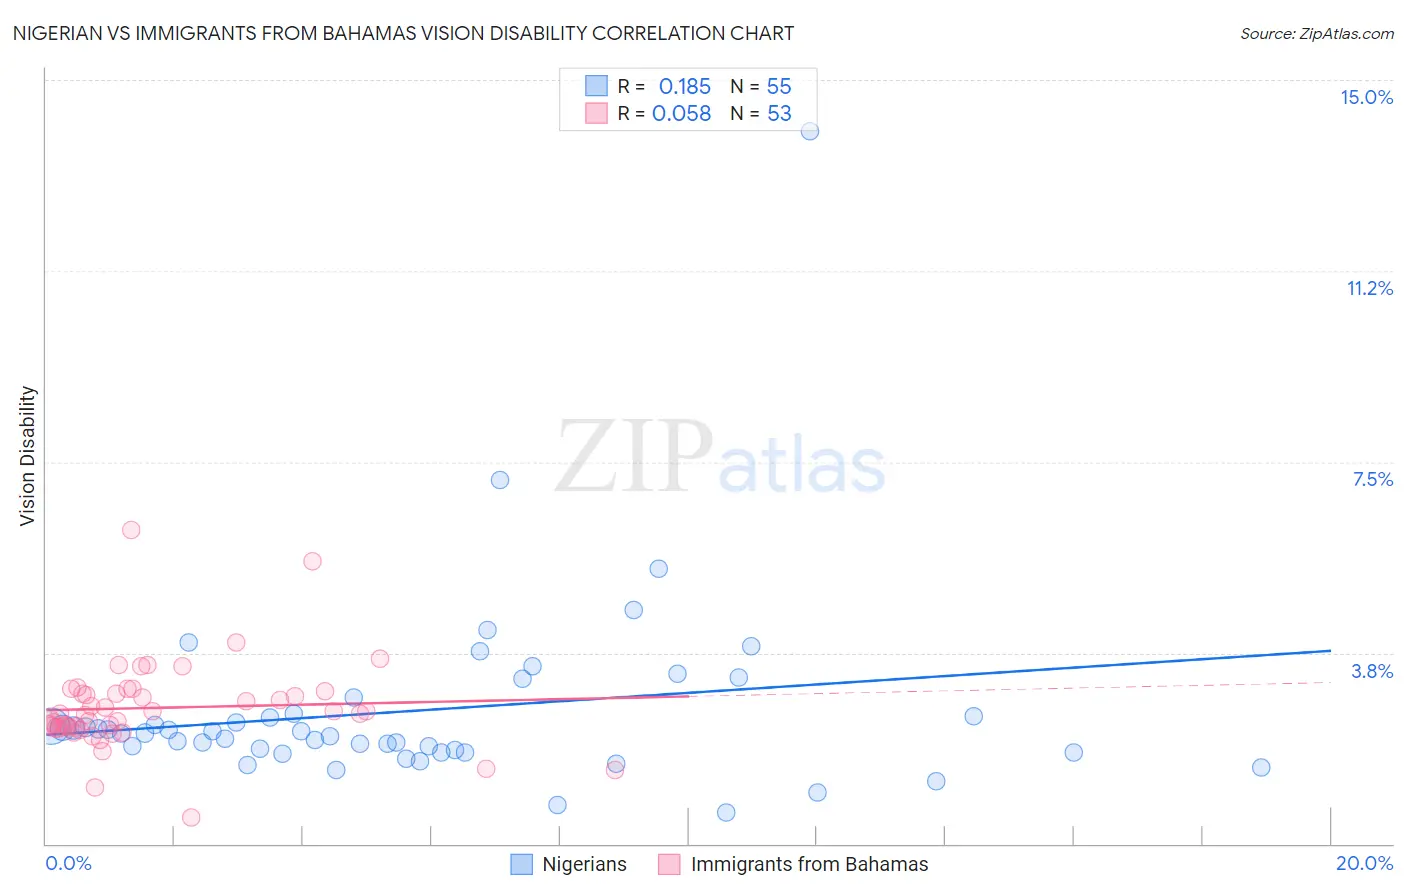
Nigerian vs Immigrants from Bahamas Vision Disability Correlation Chart
The statistical analysis conducted on geographies consisting of 332,578,519 people shows a poor positive correlation between the proportion of Nigerians and percentage of population with vision disability in the United States with a correlation coefficient (R) of 0.185 and weighted average of 2.3%. Similarly, the statistical analysis conducted on geographies consisting of 104,644,216 people shows a slight positive correlation between the proportion of Immigrants from Bahamas and percentage of population with vision disability in the United States with a correlation coefficient (R) of 0.058 and weighted average of 2.4%, a difference of 7.5%.
Vision Disability Correlation Summary
| Measurement | Nigerian | Immigrants from Bahamas |
| Minimum | 0.62% | 0.51% |
| Maximum | 14.0% | 6.2% |
| Range | 13.4% | 5.7% |
| Mean | 2.6% | 2.7% |
| Median | 2.2% | 2.5% |
| Interquartile 25% (IQ1) | 1.8% | 2.3% |
| Interquartile 75% (IQ3) | 2.5% | 3.0% |
| Interquartile Range (IQR) | 0.74% | 0.70% |
| Standard Deviation (Sample) | 1.9% | 0.89% |
| Standard Deviation (Population) | 1.9% | 0.88% |
Similar Demographics by Vision Disability
Demographics Similar to Nigerians by Vision Disability
In terms of vision disability, the demographic groups most similar to Nigerians are Trinidadian and Tobagonian (2.2%, a difference of 0.21%), Immigrants from Trinidad and Tobago (2.3%, a difference of 0.29%), Immigrants from Ghana (2.2%, a difference of 0.34%), Bermudan (2.2%, a difference of 0.35%), and Indonesian (2.2%, a difference of 0.44%).
| Demographics | Rating | Rank | Vision Disability |
| Germans | 13.4 /100 | #208 | Poor 2.2% |
| Immigrants | Brazil | 13.1 /100 | #209 | Poor 2.2% |
| Immigrants | Uruguay | 11.5 /100 | #210 | Poor 2.2% |
| Indonesians | 9.5 /100 | #211 | Tragic 2.2% |
| Bermudans | 9.0 /100 | #212 | Tragic 2.2% |
| Immigrants | Ghana | 8.9 /100 | #213 | Tragic 2.2% |
| Trinidadians and Tobagonians | 8.2 /100 | #214 | Tragic 2.2% |
| Nigerians | 7.2 /100 | #215 | Tragic 2.3% |
| Immigrants | Trinidad and Tobago | 6.1 /100 | #216 | Tragic 2.3% |
| Barbadians | 5.1 /100 | #217 | Tragic 2.3% |
| Portuguese | 4.9 /100 | #218 | Tragic 2.3% |
| Ecuadorians | 4.6 /100 | #219 | Tragic 2.3% |
| Guamanians/Chamorros | 3.9 /100 | #220 | Tragic 2.3% |
| French Canadians | 3.9 /100 | #221 | Tragic 2.3% |
| Immigrants | Senegal | 3.8 /100 | #222 | Tragic 2.3% |
Demographics Similar to Immigrants from Bahamas by Vision Disability
In terms of vision disability, the demographic groups most similar to Immigrants from Bahamas are Immigrants from Latin America (2.4%, a difference of 0.31%), Spaniard (2.4%, a difference of 0.33%), Immigrants from the Azores (2.4%, a difference of 0.43%), Cuban (2.4%, a difference of 0.59%), and Celtic (2.4%, a difference of 0.60%).
| Demographics | Rating | Rank | Vision Disability |
| Mexican American Indians | 0.1 /100 | #266 | Tragic 2.4% |
| Ute | 0.1 /100 | #267 | Tragic 2.4% |
| Senegalese | 0.1 /100 | #268 | Tragic 2.4% |
| Celtics | 0.1 /100 | #269 | Tragic 2.4% |
| Cubans | 0.1 /100 | #270 | Tragic 2.4% |
| Immigrants | Azores | 0.1 /100 | #271 | Tragic 2.4% |
| Spaniards | 0.1 /100 | #272 | Tragic 2.4% |
| Immigrants | Bahamas | 0.1 /100 | #273 | Tragic 2.4% |
| Immigrants | Latin America | 0.0 /100 | #274 | Tragic 2.4% |
| Chippewa | 0.0 /100 | #275 | Tragic 2.4% |
| Scotch-Irish | 0.0 /100 | #276 | Tragic 2.4% |
| Bahamians | 0.0 /100 | #277 | Tragic 2.4% |
| Spanish | 0.0 /100 | #278 | Tragic 2.4% |
| Nepalese | 0.0 /100 | #279 | Tragic 2.4% |
| Cape Verdeans | 0.0 /100 | #280 | Tragic 2.4% |