Ugandan vs Immigrants from Bahamas Vision Disability
COMPARE
Ugandan
Immigrants from Bahamas
Vision Disability
Vision Disability Comparison
Ugandans
Immigrants from Bahamas
2.1%
VISION DISABILITY
92.2/ 100
METRIC RATING
116th/ 347
METRIC RANK
2.4%
VISION DISABILITY
0.1/ 100
METRIC RATING
273rd/ 347
METRIC RANK
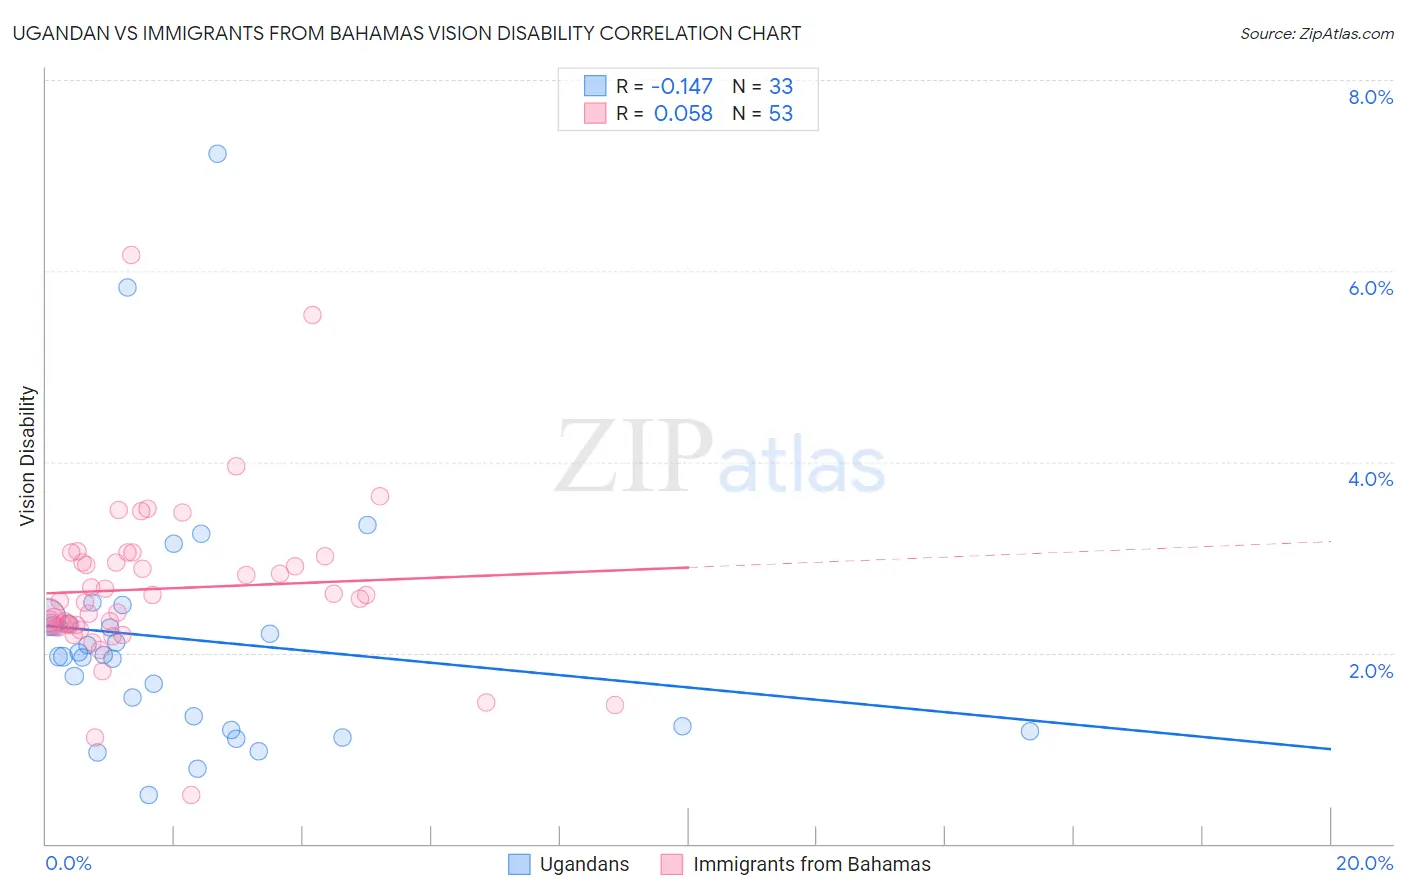
Ugandan vs Immigrants from Bahamas Vision Disability Correlation Chart
The statistical analysis conducted on geographies consisting of 94,002,961 people shows a poor negative correlation between the proportion of Ugandans and percentage of population with vision disability in the United States with a correlation coefficient (R) of -0.147 and weighted average of 2.1%. Similarly, the statistical analysis conducted on geographies consisting of 104,644,216 people shows a slight positive correlation between the proportion of Immigrants from Bahamas and percentage of population with vision disability in the United States with a correlation coefficient (R) of 0.058 and weighted average of 2.4%, a difference of 16.4%.
Vision Disability Correlation Summary
| Measurement | Ugandan | Immigrants from Bahamas |
| Minimum | 0.51% | 0.51% |
| Maximum | 7.2% | 6.2% |
| Range | 6.7% | 5.7% |
| Mean | 2.1% | 2.7% |
| Median | 2.0% | 2.5% |
| Interquartile 25% (IQ1) | 1.2% | 2.3% |
| Interquartile 75% (IQ3) | 2.3% | 3.0% |
| Interquartile Range (IQR) | 1.1% | 0.70% |
| Standard Deviation (Sample) | 1.3% | 0.89% |
| Standard Deviation (Population) | 1.3% | 0.88% |
Similar Demographics by Vision Disability
Demographics Similar to Ugandans by Vision Disability
In terms of vision disability, the demographic groups most similar to Ugandans are Immigrants from Vietnam (2.1%, a difference of 0.0%), Croatian (2.1%, a difference of 0.030%), Polish (2.1%, a difference of 0.040%), Kenyan (2.1%, a difference of 0.060%), and Immigrants from Denmark (2.1%, a difference of 0.18%).
| Demographics | Rating | Rank | Vision Disability |
| Chileans | 94.0 /100 | #109 | Exceptional 2.1% |
| Immigrants | Armenia | 93.8 /100 | #110 | Exceptional 2.1% |
| Peruvians | 93.5 /100 | #111 | Exceptional 2.1% |
| Immigrants | Denmark | 92.9 /100 | #112 | Exceptional 2.1% |
| Kenyans | 92.5 /100 | #113 | Exceptional 2.1% |
| Croatians | 92.3 /100 | #114 | Exceptional 2.1% |
| Immigrants | Vietnam | 92.2 /100 | #115 | Exceptional 2.1% |
| Ugandans | 92.2 /100 | #116 | Exceptional 2.1% |
| Poles | 92.0 /100 | #117 | Exceptional 2.1% |
| Immigrants | Philippines | 91.4 /100 | #118 | Exceptional 2.1% |
| Immigrants | Uganda | 91.4 /100 | #119 | Exceptional 2.1% |
| Immigrants | Zimbabwe | 91.0 /100 | #120 | Exceptional 2.1% |
| Immigrants | Scotland | 90.4 /100 | #121 | Exceptional 2.1% |
| Immigrants | Ukraine | 90.4 /100 | #122 | Exceptional 2.1% |
| Immigrants | Albania | 90.4 /100 | #123 | Exceptional 2.1% |
Demographics Similar to Immigrants from Bahamas by Vision Disability
In terms of vision disability, the demographic groups most similar to Immigrants from Bahamas are Immigrants from Latin America (2.4%, a difference of 0.31%), Spaniard (2.4%, a difference of 0.33%), Immigrants from the Azores (2.4%, a difference of 0.43%), Cuban (2.4%, a difference of 0.59%), and Celtic (2.4%, a difference of 0.60%).
| Demographics | Rating | Rank | Vision Disability |
| Mexican American Indians | 0.1 /100 | #266 | Tragic 2.4% |
| Ute | 0.1 /100 | #267 | Tragic 2.4% |
| Senegalese | 0.1 /100 | #268 | Tragic 2.4% |
| Celtics | 0.1 /100 | #269 | Tragic 2.4% |
| Cubans | 0.1 /100 | #270 | Tragic 2.4% |
| Immigrants | Azores | 0.1 /100 | #271 | Tragic 2.4% |
| Spaniards | 0.1 /100 | #272 | Tragic 2.4% |
| Immigrants | Bahamas | 0.1 /100 | #273 | Tragic 2.4% |
| Immigrants | Latin America | 0.0 /100 | #274 | Tragic 2.4% |
| Chippewa | 0.0 /100 | #275 | Tragic 2.4% |
| Scotch-Irish | 0.0 /100 | #276 | Tragic 2.4% |
| Bahamians | 0.0 /100 | #277 | Tragic 2.4% |
| Spanish | 0.0 /100 | #278 | Tragic 2.4% |
| Nepalese | 0.0 /100 | #279 | Tragic 2.4% |
| Cape Verdeans | 0.0 /100 | #280 | Tragic 2.4% |