Swedish vs Immigrants from Hungary Disability Age Under 5
COMPARE
Swedish
Immigrants from Hungary
Disability Age Under 5
Disability Age Under 5 Comparison
Swedes
Immigrants from Hungary
1.6%
DISABILITY AGE UNDER 5
0.0/ 100
METRIC RATING
294th/ 347
METRIC RANK
1.4%
DISABILITY AGE UNDER 5
1.0/ 100
METRIC RATING
251st/ 347
METRIC RANK
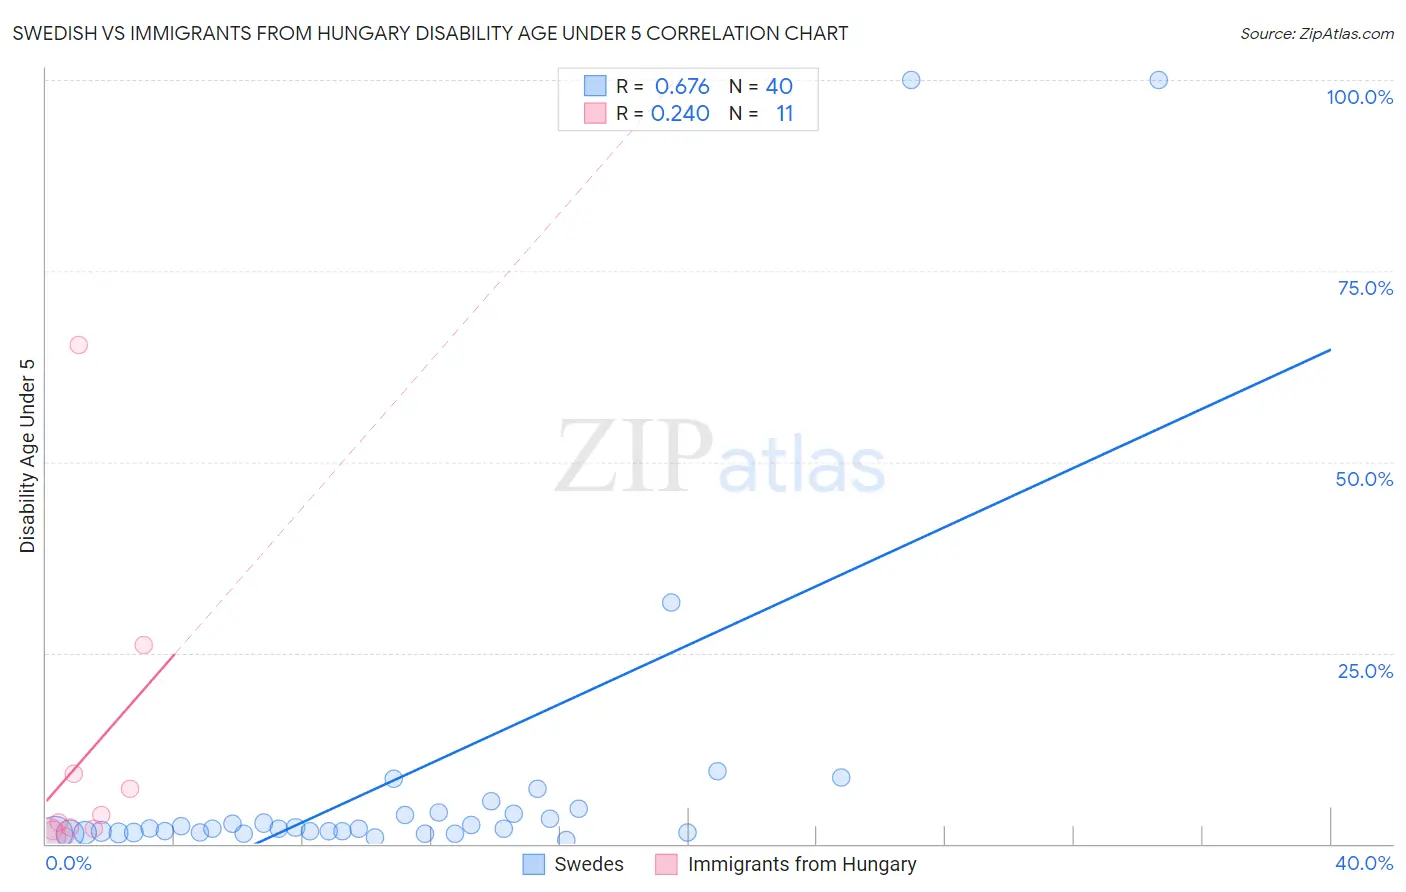
Swedish vs Immigrants from Hungary Disability Age Under 5 Correlation Chart
The statistical analysis conducted on geographies consisting of 252,407,274 people shows a significant positive correlation between the proportion of Swedes and percentage of population with a disability under the age of 5 in the United States with a correlation coefficient (R) of 0.676 and weighted average of 1.6%. Similarly, the statistical analysis conducted on geographies consisting of 126,295,139 people shows a weak positive correlation between the proportion of Immigrants from Hungary and percentage of population with a disability under the age of 5 in the United States with a correlation coefficient (R) of 0.240 and weighted average of 1.4%, a difference of 15.3%.
Disability Age Under 5 Correlation Summary
| Measurement | Swedish | Immigrants from Hungary |
| Minimum | 0.49% | 0.96% |
| Maximum | 100.0% | 65.4% |
| Range | 99.5% | 64.4% |
| Mean | 8.4% | 11.1% |
| Median | 2.0% | 2.9% |
| Interquartile 25% (IQ1) | 1.5% | 1.8% |
| Interquartile 75% (IQ3) | 4.0% | 9.2% |
| Interquartile Range (IQR) | 2.5% | 7.4% |
| Standard Deviation (Sample) | 21.9% | 19.4% |
| Standard Deviation (Population) | 21.6% | 18.5% |
Similar Demographics by Disability Age Under 5
Demographics Similar to Swedes by Disability Age Under 5
In terms of disability age under 5, the demographic groups most similar to Swedes are Finnish (1.6%, a difference of 0.62%), Polish (1.6%, a difference of 0.71%), Lithuanian (1.6%, a difference of 1.2%), Italian (1.6%, a difference of 1.7%), and Nonimmigrants (1.6%, a difference of 1.7%).
| Demographics | Rating | Rank | Disability Age Under 5 |
| Scandinavians | 0.0 /100 | #287 | Tragic 1.5% |
| Estonians | 0.0 /100 | #288 | Tragic 1.5% |
| Hungarians | 0.0 /100 | #289 | Tragic 1.5% |
| Czechs | 0.0 /100 | #290 | Tragic 1.5% |
| Northern Europeans | 0.0 /100 | #291 | Tragic 1.6% |
| Italians | 0.0 /100 | #292 | Tragic 1.6% |
| Lithuanians | 0.0 /100 | #293 | Tragic 1.6% |
| Swedes | 0.0 /100 | #294 | Tragic 1.6% |
| Finns | 0.0 /100 | #295 | Tragic 1.6% |
| Poles | 0.0 /100 | #296 | Tragic 1.6% |
| Immigrants | Nonimmigrants | 0.0 /100 | #297 | Tragic 1.6% |
| Cajuns | 0.0 /100 | #298 | Tragic 1.6% |
| Portuguese | 0.0 /100 | #299 | Tragic 1.6% |
| Shoshone | 0.0 /100 | #300 | Tragic 1.6% |
| German Russians | 0.0 /100 | #301 | Tragic 1.6% |
Demographics Similar to Immigrants from Hungary by Disability Age Under 5
In terms of disability age under 5, the demographic groups most similar to Immigrants from Hungary are African (1.4%, a difference of 0.030%), Bermudan (1.4%, a difference of 0.040%), Immigrants from Scotland (1.4%, a difference of 0.040%), Eastern European (1.4%, a difference of 0.12%), and Immigrants from England (1.4%, a difference of 0.15%).
| Demographics | Rating | Rank | Disability Age Under 5 |
| Spaniards | 1.4 /100 | #244 | Tragic 1.4% |
| Potawatomi | 1.1 /100 | #245 | Tragic 1.4% |
| Russians | 1.0 /100 | #246 | Tragic 1.4% |
| Immigrants | England | 1.0 /100 | #247 | Tragic 1.4% |
| Eastern Europeans | 1.0 /100 | #248 | Tragic 1.4% |
| Bermudans | 1.0 /100 | #249 | Tragic 1.4% |
| Africans | 1.0 /100 | #250 | Tragic 1.4% |
| Immigrants | Hungary | 1.0 /100 | #251 | Tragic 1.4% |
| Immigrants | Scotland | 0.9 /100 | #252 | Tragic 1.4% |
| Australians | 0.7 /100 | #253 | Tragic 1.4% |
| Immigrants | Brazil | 0.7 /100 | #254 | Tragic 1.4% |
| Immigrants | Liberia | 0.6 /100 | #255 | Tragic 1.4% |
| Immigrants | Western Europe | 0.5 /100 | #256 | Tragic 1.4% |
| Slovenes | 0.3 /100 | #257 | Tragic 1.4% |
| Costa Ricans | 0.3 /100 | #258 | Tragic 1.4% |