Immigrants from Eastern Europe vs Immigrants from Hungary Disability Age Under 5
COMPARE
Immigrants from Eastern Europe
Immigrants from Hungary
Disability Age Under 5
Disability Age Under 5 Comparison
Immigrants from Eastern Europe
Immigrants from Hungary
1.2%
DISABILITY AGE UNDER 5
87.3/ 100
METRIC RATING
132nd/ 347
METRIC RANK
1.4%
DISABILITY AGE UNDER 5
1.0/ 100
METRIC RATING
251st/ 347
METRIC RANK
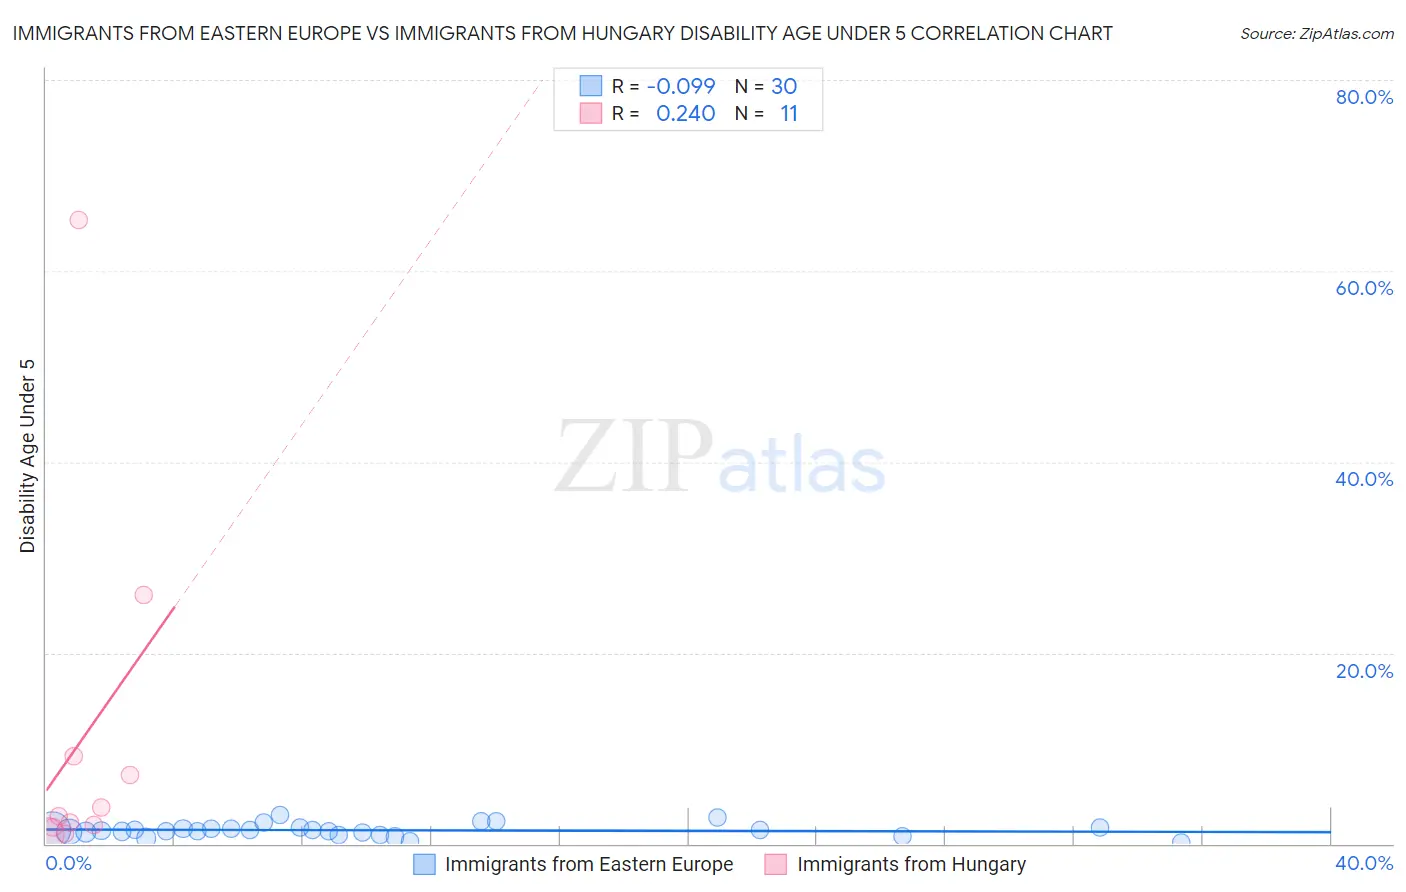
Immigrants from Eastern Europe vs Immigrants from Hungary Disability Age Under 5 Correlation Chart
The statistical analysis conducted on geographies consisting of 238,831,342 people shows a slight negative correlation between the proportion of Immigrants from Eastern Europe and percentage of population with a disability under the age of 5 in the United States with a correlation coefficient (R) of -0.099 and weighted average of 1.2%. Similarly, the statistical analysis conducted on geographies consisting of 126,295,139 people shows a weak positive correlation between the proportion of Immigrants from Hungary and percentage of population with a disability under the age of 5 in the United States with a correlation coefficient (R) of 0.240 and weighted average of 1.4%, a difference of 15.5%.
Disability Age Under 5 Correlation Summary
| Measurement | Immigrants from Eastern Europe | Immigrants from Hungary |
| Minimum | 0.14% | 0.96% |
| Maximum | 3.0% | 65.4% |
| Range | 2.8% | 64.4% |
| Mean | 1.4% | 11.1% |
| Median | 1.4% | 2.9% |
| Interquartile 25% (IQ1) | 1.1% | 1.8% |
| Interquartile 75% (IQ3) | 1.6% | 9.2% |
| Interquartile Range (IQR) | 0.47% | 7.4% |
| Standard Deviation (Sample) | 0.64% | 19.4% |
| Standard Deviation (Population) | 0.63% | 18.5% |
Similar Demographics by Disability Age Under 5
Demographics Similar to Immigrants from Eastern Europe by Disability Age Under 5
In terms of disability age under 5, the demographic groups most similar to Immigrants from Eastern Europe are Immigrants from Serbia (1.2%, a difference of 0.070%), Korean (1.2%, a difference of 0.090%), Immigrants (1.2%, a difference of 0.16%), Immigrants from Spain (1.2%, a difference of 0.16%), and Immigrants from France (1.2%, a difference of 0.25%).
| Demographics | Rating | Rank | Disability Age Under 5 |
| Japanese | 90.3 /100 | #125 | Exceptional 1.2% |
| Central Americans | 89.7 /100 | #126 | Excellent 1.2% |
| Immigrants | Romania | 88.4 /100 | #127 | Excellent 1.2% |
| Immigrants | France | 88.4 /100 | #128 | Excellent 1.2% |
| Immigrants | Immigrants | 88.0 /100 | #129 | Excellent 1.2% |
| Koreans | 87.7 /100 | #130 | Excellent 1.2% |
| Immigrants | Serbia | 87.6 /100 | #131 | Excellent 1.2% |
| Immigrants | Eastern Europe | 87.3 /100 | #132 | Excellent 1.2% |
| Immigrants | Spain | 86.5 /100 | #133 | Excellent 1.2% |
| Argentineans | 85.7 /100 | #134 | Excellent 1.2% |
| Fijians | 84.7 /100 | #135 | Excellent 1.2% |
| Moroccans | 83.6 /100 | #136 | Excellent 1.2% |
| Immigrants | Eastern Africa | 83.1 /100 | #137 | Excellent 1.2% |
| Immigrants | Czechoslovakia | 82.8 /100 | #138 | Excellent 1.2% |
| New Zealanders | 81.4 /100 | #139 | Excellent 1.2% |
Demographics Similar to Immigrants from Hungary by Disability Age Under 5
In terms of disability age under 5, the demographic groups most similar to Immigrants from Hungary are African (1.4%, a difference of 0.030%), Bermudan (1.4%, a difference of 0.040%), Immigrants from Scotland (1.4%, a difference of 0.040%), Eastern European (1.4%, a difference of 0.12%), and Immigrants from England (1.4%, a difference of 0.15%).
| Demographics | Rating | Rank | Disability Age Under 5 |
| Spaniards | 1.4 /100 | #244 | Tragic 1.4% |
| Potawatomi | 1.1 /100 | #245 | Tragic 1.4% |
| Russians | 1.0 /100 | #246 | Tragic 1.4% |
| Immigrants | England | 1.0 /100 | #247 | Tragic 1.4% |
| Eastern Europeans | 1.0 /100 | #248 | Tragic 1.4% |
| Bermudans | 1.0 /100 | #249 | Tragic 1.4% |
| Africans | 1.0 /100 | #250 | Tragic 1.4% |
| Immigrants | Hungary | 1.0 /100 | #251 | Tragic 1.4% |
| Immigrants | Scotland | 0.9 /100 | #252 | Tragic 1.4% |
| Australians | 0.7 /100 | #253 | Tragic 1.4% |
| Immigrants | Brazil | 0.7 /100 | #254 | Tragic 1.4% |
| Immigrants | Liberia | 0.6 /100 | #255 | Tragic 1.4% |
| Immigrants | Western Europe | 0.5 /100 | #256 | Tragic 1.4% |
| Slovenes | 0.3 /100 | #257 | Tragic 1.4% |
| Costa Ricans | 0.3 /100 | #258 | Tragic 1.4% |