Swedish vs Hawaiian Disability Age Under 5
COMPARE
Swedish
Hawaiian
Disability Age Under 5
Disability Age Under 5 Comparison
Swedes
Hawaiians
1.6%
DISABILITY AGE UNDER 5
0.0/ 100
METRIC RATING
294th/ 347
METRIC RANK
1.2%
DISABILITY AGE UNDER 5
68.5/ 100
METRIC RATING
156th/ 347
METRIC RANK
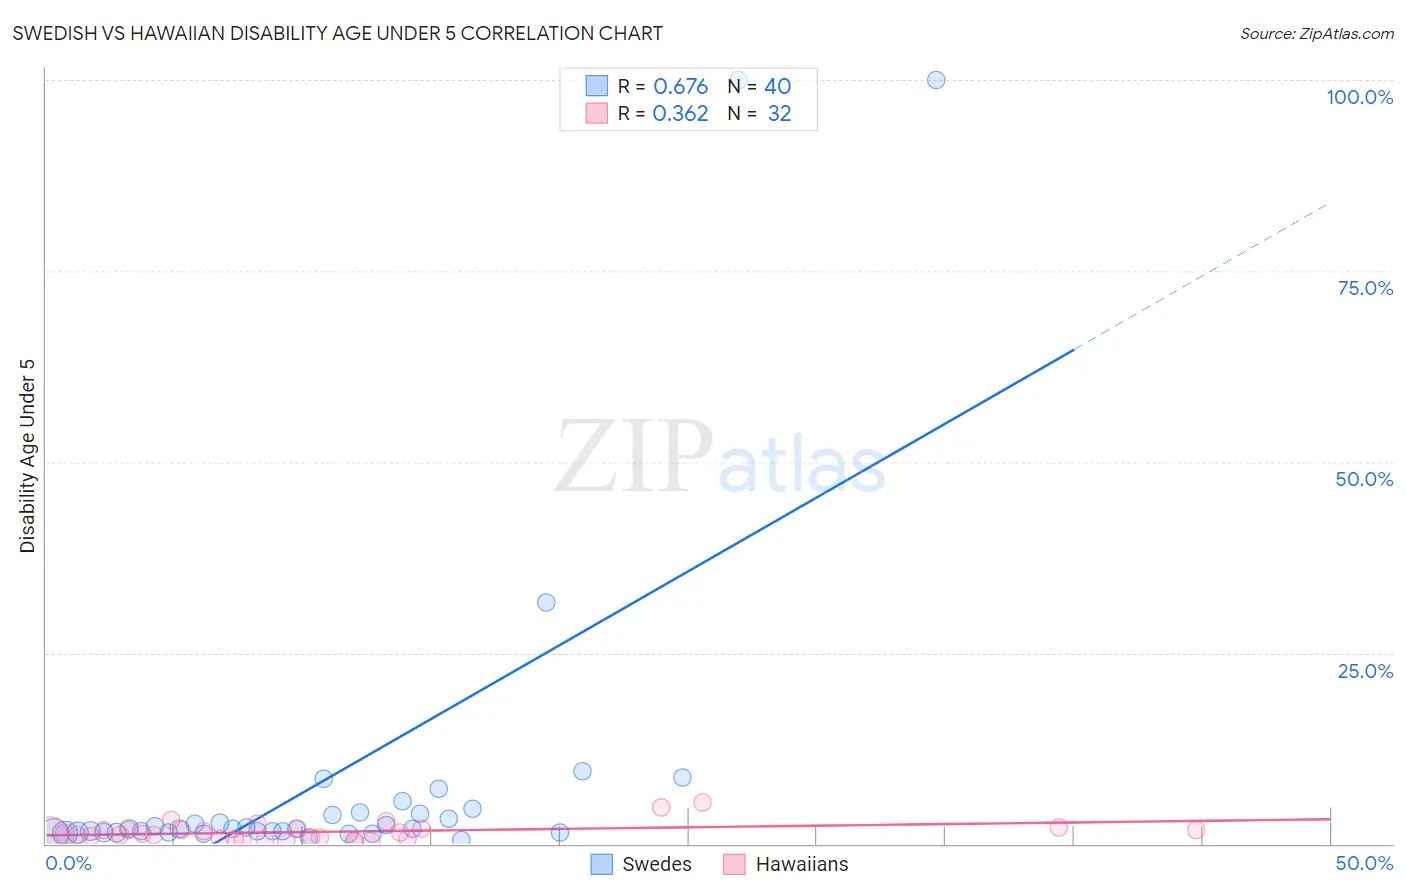
Swedish vs Hawaiian Disability Age Under 5 Correlation Chart
The statistical analysis conducted on geographies consisting of 252,407,274 people shows a significant positive correlation between the proportion of Swedes and percentage of population with a disability under the age of 5 in the United States with a correlation coefficient (R) of 0.676 and weighted average of 1.6%. Similarly, the statistical analysis conducted on geographies consisting of 194,372,876 people shows a mild positive correlation between the proportion of Hawaiians and percentage of population with a disability under the age of 5 in the United States with a correlation coefficient (R) of 0.362 and weighted average of 1.2%, a difference of 29.7%.
Disability Age Under 5 Correlation Summary
| Measurement | Swedish | Hawaiian |
| Minimum | 0.49% | 0.35% |
| Maximum | 100.0% | 5.3% |
| Range | 99.5% | 5.0% |
| Mean | 8.4% | 1.6% |
| Median | 2.0% | 1.2% |
| Interquartile 25% (IQ1) | 1.5% | 0.66% |
| Interquartile 75% (IQ3) | 4.0% | 1.9% |
| Interquartile Range (IQR) | 2.5% | 1.3% |
| Standard Deviation (Sample) | 21.9% | 1.2% |
| Standard Deviation (Population) | 21.6% | 1.2% |
Similar Demographics by Disability Age Under 5
Demographics Similar to Swedes by Disability Age Under 5
In terms of disability age under 5, the demographic groups most similar to Swedes are Finnish (1.6%, a difference of 0.62%), Polish (1.6%, a difference of 0.71%), Lithuanian (1.6%, a difference of 1.2%), Italian (1.6%, a difference of 1.7%), and Nonimmigrants (1.6%, a difference of 1.7%).
| Demographics | Rating | Rank | Disability Age Under 5 |
| Scandinavians | 0.0 /100 | #287 | Tragic 1.5% |
| Estonians | 0.0 /100 | #288 | Tragic 1.5% |
| Hungarians | 0.0 /100 | #289 | Tragic 1.5% |
| Czechs | 0.0 /100 | #290 | Tragic 1.5% |
| Northern Europeans | 0.0 /100 | #291 | Tragic 1.6% |
| Italians | 0.0 /100 | #292 | Tragic 1.6% |
| Lithuanians | 0.0 /100 | #293 | Tragic 1.6% |
| Swedes | 0.0 /100 | #294 | Tragic 1.6% |
| Finns | 0.0 /100 | #295 | Tragic 1.6% |
| Poles | 0.0 /100 | #296 | Tragic 1.6% |
| Immigrants | Nonimmigrants | 0.0 /100 | #297 | Tragic 1.6% |
| Cajuns | 0.0 /100 | #298 | Tragic 1.6% |
| Portuguese | 0.0 /100 | #299 | Tragic 1.6% |
| Shoshone | 0.0 /100 | #300 | Tragic 1.6% |
| German Russians | 0.0 /100 | #301 | Tragic 1.6% |
Demographics Similar to Hawaiians by Disability Age Under 5
In terms of disability age under 5, the demographic groups most similar to Hawaiians are Immigrants from Ghana (1.2%, a difference of 0.020%), Uruguayan (1.2%, a difference of 0.030%), Immigrants from Thailand (1.2%, a difference of 0.10%), Immigrants from South America (1.2%, a difference of 0.16%), and Arab (1.2%, a difference of 0.22%).
| Demographics | Rating | Rank | Disability Age Under 5 |
| Kenyans | 75.9 /100 | #149 | Good 1.2% |
| South Americans | 75.6 /100 | #150 | Good 1.2% |
| Yaqui | 74.8 /100 | #151 | Good 1.2% |
| Hondurans | 72.5 /100 | #152 | Good 1.2% |
| Immigrants | Thailand | 69.4 /100 | #153 | Good 1.2% |
| Uruguayans | 68.8 /100 | #154 | Good 1.2% |
| Immigrants | Ghana | 68.7 /100 | #155 | Good 1.2% |
| Hawaiians | 68.5 /100 | #156 | Good 1.2% |
| Immigrants | South America | 67.0 /100 | #157 | Good 1.2% |
| Arabs | 66.4 /100 | #158 | Good 1.2% |
| Colombians | 65.8 /100 | #159 | Good 1.2% |
| Immigrants | Latin America | 65.8 /100 | #160 | Good 1.2% |
| Immigrants | Africa | 65.1 /100 | #161 | Good 1.2% |
| Guatemalans | 63.6 /100 | #162 | Good 1.2% |
| Immigrants | Guatemala | 63.2 /100 | #163 | Good 1.2% |