Swedish vs Immigrants from Hungary Vision Disability
COMPARE
Swedish
Immigrants from Hungary
Vision Disability
Vision Disability Comparison
Swedes
Immigrants from Hungary
2.1%
VISION DISABILITY
94.2/ 100
METRIC RATING
106th/ 347
METRIC RANK
2.1%
VISION DISABILITY
88.7/ 100
METRIC RATING
131st/ 347
METRIC RANK
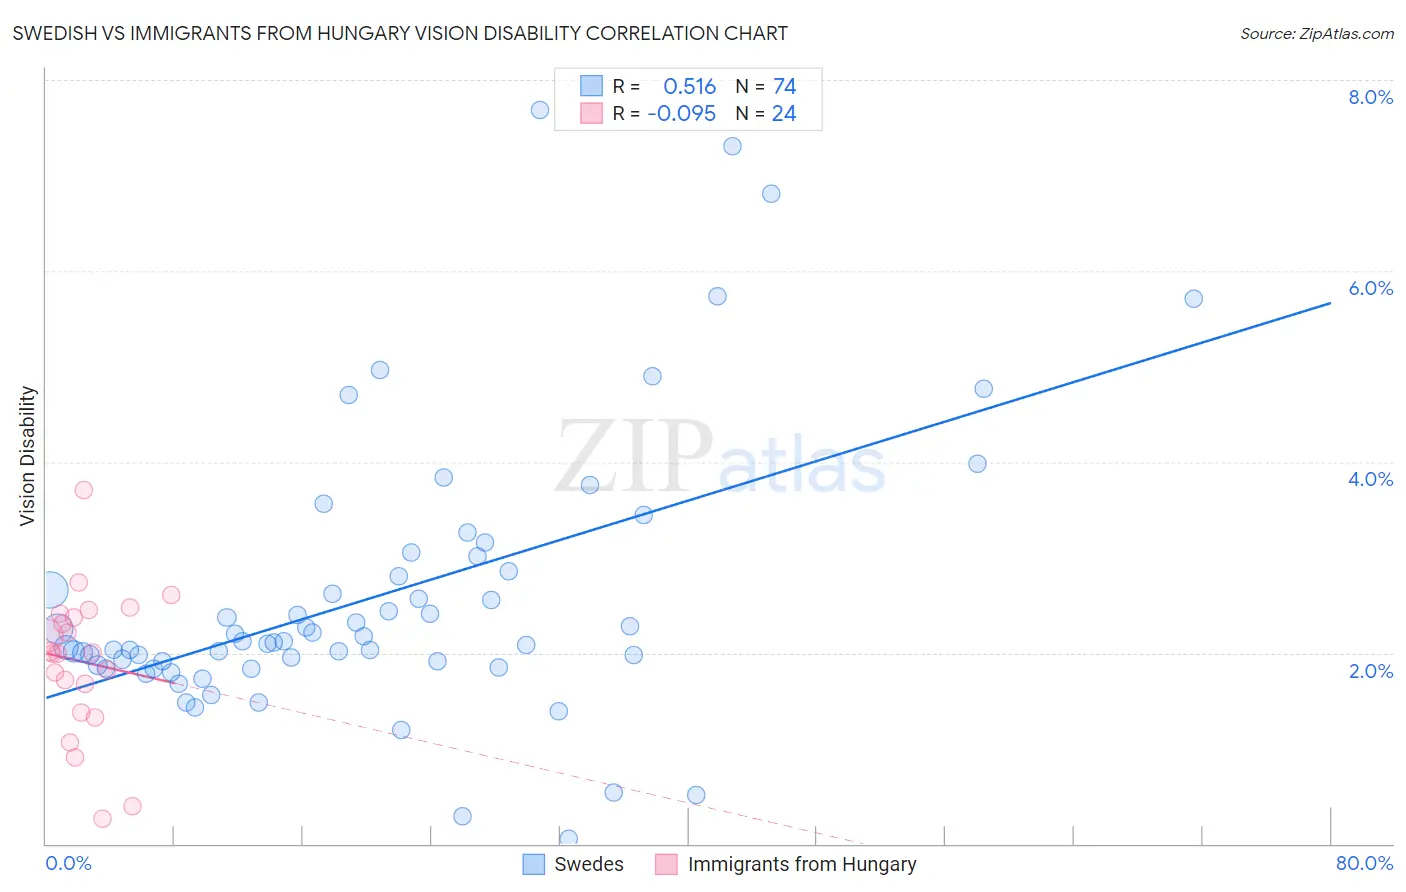
Swedish vs Immigrants from Hungary Vision Disability Correlation Chart
The statistical analysis conducted on geographies consisting of 537,778,731 people shows a substantial positive correlation between the proportion of Swedes and percentage of population with vision disability in the United States with a correlation coefficient (R) of 0.516 and weighted average of 2.1%. Similarly, the statistical analysis conducted on geographies consisting of 195,649,550 people shows a slight negative correlation between the proportion of Immigrants from Hungary and percentage of population with vision disability in the United States with a correlation coefficient (R) of -0.095 and weighted average of 2.1%, a difference of 1.2%.
Vision Disability Correlation Summary
| Measurement | Swedish | Immigrants from Hungary |
| Minimum | 0.053% | 0.26% |
| Maximum | 7.7% | 3.7% |
| Range | 7.6% | 3.5% |
| Mean | 2.6% | 1.9% |
| Median | 2.1% | 2.0% |
| Interquartile 25% (IQ1) | 1.9% | 1.5% |
| Interquartile 75% (IQ3) | 2.9% | 2.4% |
| Interquartile Range (IQR) | 0.99% | 0.87% |
| Standard Deviation (Sample) | 1.5% | 0.76% |
| Standard Deviation (Population) | 1.4% | 0.75% |
Similar Demographics by Vision Disability
Demographics Similar to Swedes by Vision Disability
In terms of vision disability, the demographic groups most similar to Swedes are Danish (2.1%, a difference of 0.010%), Korean (2.1%, a difference of 0.030%), Carpatho Rusyn (2.1%, a difference of 0.040%), Chilean (2.1%, a difference of 0.050%), and Immigrants from Italy (2.1%, a difference of 0.060%).
| Demographics | Rating | Rank | Vision Disability |
| Estonians | 95.3 /100 | #99 | Exceptional 2.1% |
| Greeks | 95.1 /100 | #100 | Exceptional 2.1% |
| Albanians | 94.9 /100 | #101 | Exceptional 2.1% |
| Sri Lankans | 94.8 /100 | #102 | Exceptional 2.1% |
| Immigrants | Austria | 94.4 /100 | #103 | Exceptional 2.1% |
| Immigrants | Italy | 94.4 /100 | #104 | Exceptional 2.1% |
| Carpatho Rusyns | 94.3 /100 | #105 | Exceptional 2.1% |
| Swedes | 94.2 /100 | #106 | Exceptional 2.1% |
| Danes | 94.2 /100 | #107 | Exceptional 2.1% |
| Koreans | 94.1 /100 | #108 | Exceptional 2.1% |
| Chileans | 94.0 /100 | #109 | Exceptional 2.1% |
| Immigrants | Armenia | 93.8 /100 | #110 | Exceptional 2.1% |
| Peruvians | 93.5 /100 | #111 | Exceptional 2.1% |
| Immigrants | Denmark | 92.9 /100 | #112 | Exceptional 2.1% |
| Kenyans | 92.5 /100 | #113 | Exceptional 2.1% |
Demographics Similar to Immigrants from Hungary by Vision Disability
In terms of vision disability, the demographic groups most similar to Immigrants from Hungary are Immigrants from Kenya (2.1%, a difference of 0.010%), Immigrants from Cameroon (2.1%, a difference of 0.020%), Immigrants from Chile (2.1%, a difference of 0.050%), New Zealander (2.1%, a difference of 0.080%), and Sudanese (2.1%, a difference of 0.090%).
| Demographics | Rating | Rank | Vision Disability |
| Immigrants | Spain | 89.8 /100 | #124 | Excellent 2.1% |
| Immigrants | Venezuela | 89.8 /100 | #125 | Excellent 2.1% |
| Immigrants | Peru | 89.5 /100 | #126 | Excellent 2.1% |
| Sudanese | 89.2 /100 | #127 | Excellent 2.1% |
| Immigrants | Chile | 89.0 /100 | #128 | Excellent 2.1% |
| Immigrants | Cameroon | 88.8 /100 | #129 | Excellent 2.1% |
| Immigrants | Kenya | 88.7 /100 | #130 | Excellent 2.1% |
| Immigrants | Hungary | 88.7 /100 | #131 | Excellent 2.1% |
| New Zealanders | 88.2 /100 | #132 | Excellent 2.1% |
| Syrians | 87.5 /100 | #133 | Excellent 2.1% |
| Venezuelans | 87.2 /100 | #134 | Excellent 2.1% |
| Vietnamese | 86.7 /100 | #135 | Excellent 2.1% |
| Czechs | 86.3 /100 | #136 | Excellent 2.1% |
| Immigrants | South Eastern Asia | 86.3 /100 | #137 | Excellent 2.1% |
| Arabs | 86.3 /100 | #138 | Excellent 2.1% |