Cree vs Immigrants from Hungary Disability Age Under 5
COMPARE
Cree
Immigrants from Hungary
Disability Age Under 5
Disability Age Under 5 Comparison
Cree
Immigrants from Hungary
1.4%
DISABILITY AGE UNDER 5
0.1/ 100
METRIC RATING
267th/ 347
METRIC RANK
1.4%
DISABILITY AGE UNDER 5
1.0/ 100
METRIC RATING
251st/ 347
METRIC RANK
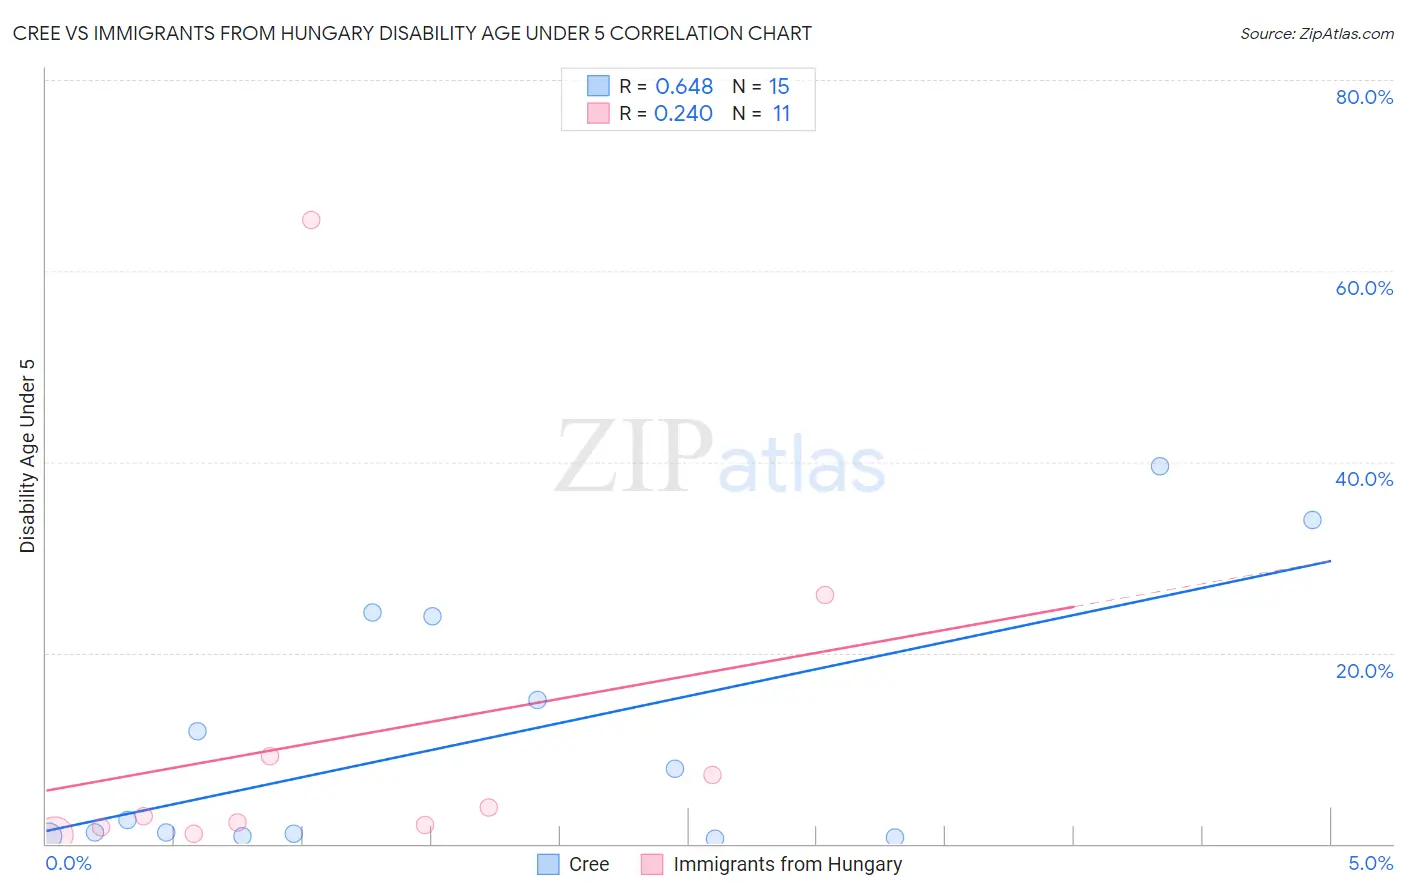
Cree vs Immigrants from Hungary Disability Age Under 5 Correlation Chart
The statistical analysis conducted on geographies consisting of 59,931,307 people shows a significant positive correlation between the proportion of Cree and percentage of population with a disability under the age of 5 in the United States with a correlation coefficient (R) of 0.648 and weighted average of 1.4%. Similarly, the statistical analysis conducted on geographies consisting of 126,295,139 people shows a weak positive correlation between the proportion of Immigrants from Hungary and percentage of population with a disability under the age of 5 in the United States with a correlation coefficient (R) of 0.240 and weighted average of 1.4%, a difference of 4.4%.
Disability Age Under 5 Correlation Summary
| Measurement | Cree | Immigrants from Hungary |
| Minimum | 0.57% | 0.96% |
| Maximum | 39.6% | 65.4% |
| Range | 39.0% | 64.4% |
| Mean | 11.0% | 11.1% |
| Median | 2.5% | 2.9% |
| Interquartile 25% (IQ1) | 0.80% | 1.8% |
| Interquartile 75% (IQ3) | 23.8% | 9.2% |
| Interquartile Range (IQR) | 23.0% | 7.4% |
| Standard Deviation (Sample) | 13.3% | 19.4% |
| Standard Deviation (Population) | 12.9% | 18.5% |
Demographics Similar to Cree and Immigrants from Hungary by Disability Age Under 5
In terms of disability age under 5, the demographic groups most similar to Cree are Immigrants from Germany (1.4%, a difference of 0.52%), Carpatho Rusyn (1.4%, a difference of 0.55%), Belgian (1.4%, a difference of 0.58%), Yugoslavian (1.4%, a difference of 0.60%), and Spanish (1.4%, a difference of 0.75%). Similarly, the demographic groups most similar to Immigrants from Hungary are African (1.4%, a difference of 0.030%), Bermudan (1.4%, a difference of 0.040%), Immigrants from Scotland (1.4%, a difference of 0.040%), Australian (1.4%, a difference of 0.72%), and Immigrants from Brazil (1.4%, a difference of 0.80%).
| Demographics | Rating | Rank | Disability Age Under 5 |
| Bermudans | 1.0 /100 | #249 | Tragic 1.4% |
| Africans | 1.0 /100 | #250 | Tragic 1.4% |
| Immigrants | Hungary | 1.0 /100 | #251 | Tragic 1.4% |
| Immigrants | Scotland | 0.9 /100 | #252 | Tragic 1.4% |
| Australians | 0.7 /100 | #253 | Tragic 1.4% |
| Immigrants | Brazil | 0.7 /100 | #254 | Tragic 1.4% |
| Immigrants | Liberia | 0.6 /100 | #255 | Tragic 1.4% |
| Immigrants | Western Europe | 0.5 /100 | #256 | Tragic 1.4% |
| Slovenes | 0.3 /100 | #257 | Tragic 1.4% |
| Costa Ricans | 0.3 /100 | #258 | Tragic 1.4% |
| Immigrants | Southern Europe | 0.3 /100 | #259 | Tragic 1.4% |
| Slavs | 0.3 /100 | #260 | Tragic 1.4% |
| Immigrants | Netherlands | 0.2 /100 | #261 | Tragic 1.4% |
| Immigrants | Dominica | 0.2 /100 | #262 | Tragic 1.4% |
| Spanish | 0.2 /100 | #263 | Tragic 1.4% |
| Yugoslavians | 0.1 /100 | #264 | Tragic 1.4% |
| Carpatho Rusyns | 0.1 /100 | #265 | Tragic 1.4% |
| Immigrants | Germany | 0.1 /100 | #266 | Tragic 1.4% |
| Cree | 0.1 /100 | #267 | Tragic 1.4% |
| Belgians | 0.1 /100 | #268 | Tragic 1.4% |
| Austrians | 0.1 /100 | #269 | Tragic 1.4% |