Sudanese vs Scandinavian Self-Care Disability
COMPARE
Sudanese
Scandinavian
Self-Care Disability
Self-Care Disability Comparison
Sudanese
Scandinavians
2.2%
SELF-CARE DISABILITY
100.0/ 100
METRIC RATING
10th/ 347
METRIC RANK
2.4%
SELF-CARE DISABILITY
93.5/ 100
METRIC RATING
112th/ 347
METRIC RANK
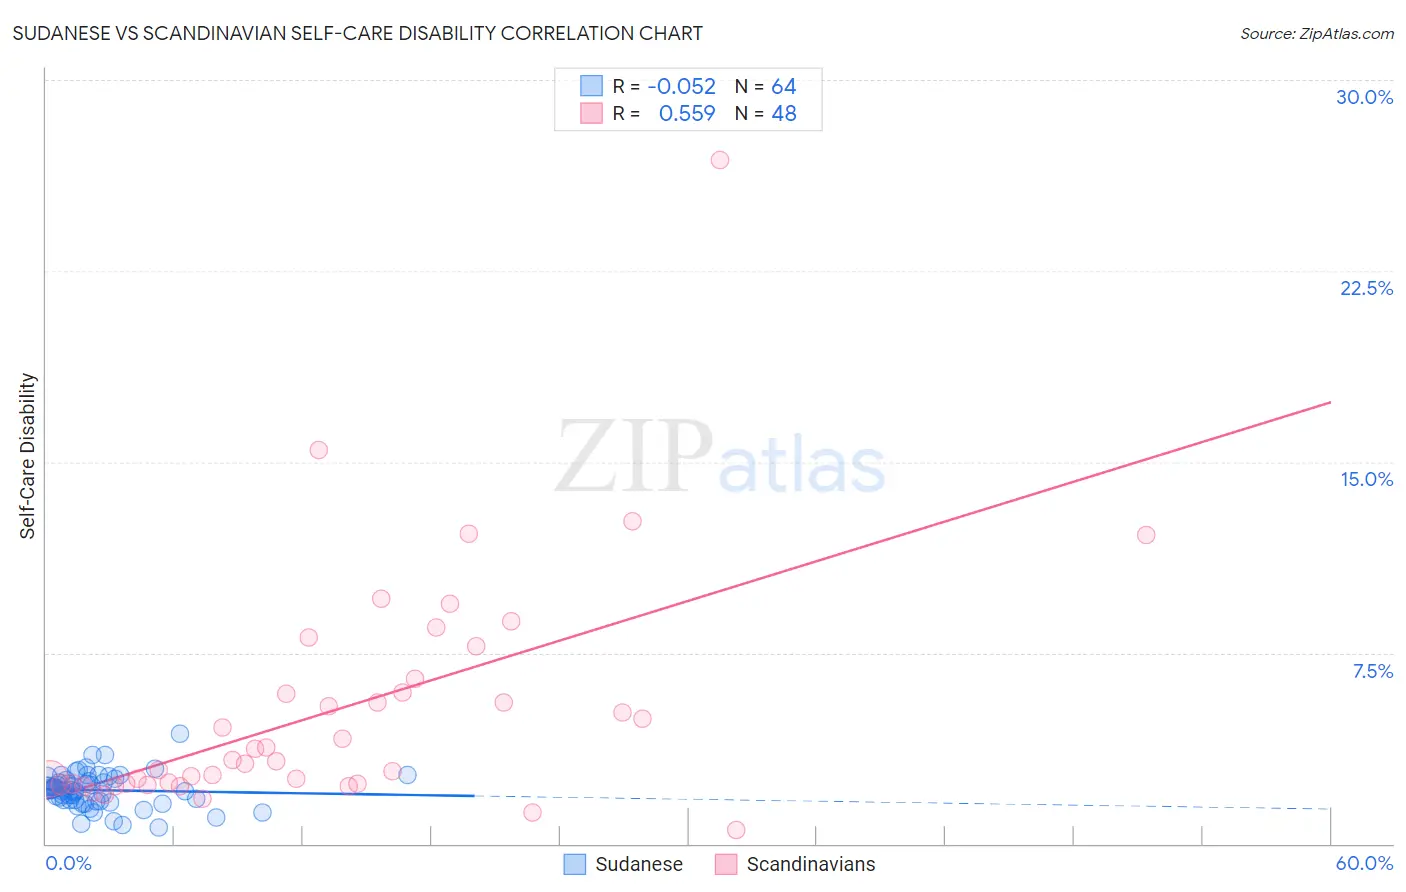
Sudanese vs Scandinavian Self-Care Disability Correlation Chart
The statistical analysis conducted on geographies consisting of 110,094,977 people shows a slight negative correlation between the proportion of Sudanese and percentage of population with self-care disability in the United States with a correlation coefficient (R) of -0.052 and weighted average of 2.2%. Similarly, the statistical analysis conducted on geographies consisting of 471,531,720 people shows a substantial positive correlation between the proportion of Scandinavians and percentage of population with self-care disability in the United States with a correlation coefficient (R) of 0.559 and weighted average of 2.4%, a difference of 9.0%.
Self-Care Disability Correlation Summary
| Measurement | Sudanese | Scandinavian |
| Minimum | 0.62% | 0.56% |
| Maximum | 4.3% | 26.9% |
| Range | 3.7% | 26.3% |
| Mean | 2.1% | 5.2% |
| Median | 2.1% | 3.3% |
| Interquartile 25% (IQ1) | 1.7% | 2.4% |
| Interquartile 75% (IQ3) | 2.5% | 6.2% |
| Interquartile Range (IQR) | 0.78% | 3.9% |
| Standard Deviation (Sample) | 0.67% | 4.7% |
| Standard Deviation (Population) | 0.67% | 4.6% |
Similar Demographics by Self-Care Disability
Demographics Similar to Sudanese by Self-Care Disability
In terms of self-care disability, the demographic groups most similar to Sudanese are Immigrants from South Central Asia (2.2%, a difference of 0.10%), Immigrants from Ethiopia (2.2%, a difference of 0.16%), Ethiopian (2.2%, a difference of 0.17%), Luxembourger (2.2%, a difference of 0.33%), and Okinawan (2.2%, a difference of 0.34%).
| Demographics | Rating | Rank | Self-Care Disability |
| Thais | 100.0 /100 | #3 | Exceptional 2.1% |
| Immigrants | Singapore | 100.0 /100 | #4 | Exceptional 2.1% |
| Zimbabweans | 100.0 /100 | #5 | Exceptional 2.2% |
| Filipinos | 100.0 /100 | #6 | Exceptional 2.2% |
| Immigrants | Bolivia | 100.0 /100 | #7 | Exceptional 2.2% |
| Bolivians | 100.0 /100 | #8 | Exceptional 2.2% |
| Immigrants | Nepal | 100.0 /100 | #9 | Exceptional 2.2% |
| Sudanese | 100.0 /100 | #10 | Exceptional 2.2% |
| Immigrants | South Central Asia | 100.0 /100 | #11 | Exceptional 2.2% |
| Immigrants | Ethiopia | 100.0 /100 | #12 | Exceptional 2.2% |
| Ethiopians | 100.0 /100 | #13 | Exceptional 2.2% |
| Luxembourgers | 100.0 /100 | #14 | Exceptional 2.2% |
| Okinawans | 100.0 /100 | #15 | Exceptional 2.2% |
| Immigrants | Kuwait | 100.0 /100 | #16 | Exceptional 2.2% |
| Immigrants | Saudi Arabia | 100.0 /100 | #17 | Exceptional 2.2% |
Demographics Similar to Scandinavians by Self-Care Disability
In terms of self-care disability, the demographic groups most similar to Scandinavians are Serbian (2.4%, a difference of 0.020%), Immigrants from Africa (2.4%, a difference of 0.050%), South American (2.4%, a difference of 0.060%), Immigrants from North Macedonia (2.4%, a difference of 0.070%), and Immigrants from Hong Kong (2.4%, a difference of 0.070%).
| Demographics | Rating | Rank | Self-Care Disability |
| Carpatho Rusyns | 94.4 /100 | #105 | Exceptional 2.4% |
| Immigrants | Indonesia | 94.3 /100 | #106 | Exceptional 2.4% |
| British | 94.3 /100 | #107 | Exceptional 2.4% |
| Greeks | 94.1 /100 | #108 | Exceptional 2.4% |
| Slovenes | 94.1 /100 | #109 | Exceptional 2.4% |
| Immigrants | Africa | 93.7 /100 | #110 | Exceptional 2.4% |
| Serbians | 93.6 /100 | #111 | Exceptional 2.4% |
| Scandinavians | 93.5 /100 | #112 | Exceptional 2.4% |
| South Americans | 93.2 /100 | #113 | Exceptional 2.4% |
| Immigrants | North Macedonia | 93.1 /100 | #114 | Exceptional 2.4% |
| Immigrants | Hong Kong | 93.1 /100 | #115 | Exceptional 2.4% |
| Northern Europeans | 92.9 /100 | #116 | Exceptional 2.4% |
| Taiwanese | 92.5 /100 | #117 | Exceptional 2.4% |
| Immigrants | Canada | 92.0 /100 | #118 | Exceptional 2.4% |
| Immigrants | Sierra Leone | 91.8 /100 | #119 | Exceptional 2.4% |