Sudanese vs Scandinavian Single Father Households
COMPARE
Sudanese
Scandinavian
Single Father Households
Single Father Households Comparison
Sudanese
Scandinavians
2.4%
SINGLE FATHER HOUSEHOLDS
13.0/ 100
METRIC RATING
219th/ 347
METRIC RANK
2.4%
SINGLE FATHER HOUSEHOLDS
27.4/ 100
METRIC RATING
198th/ 347
METRIC RANK
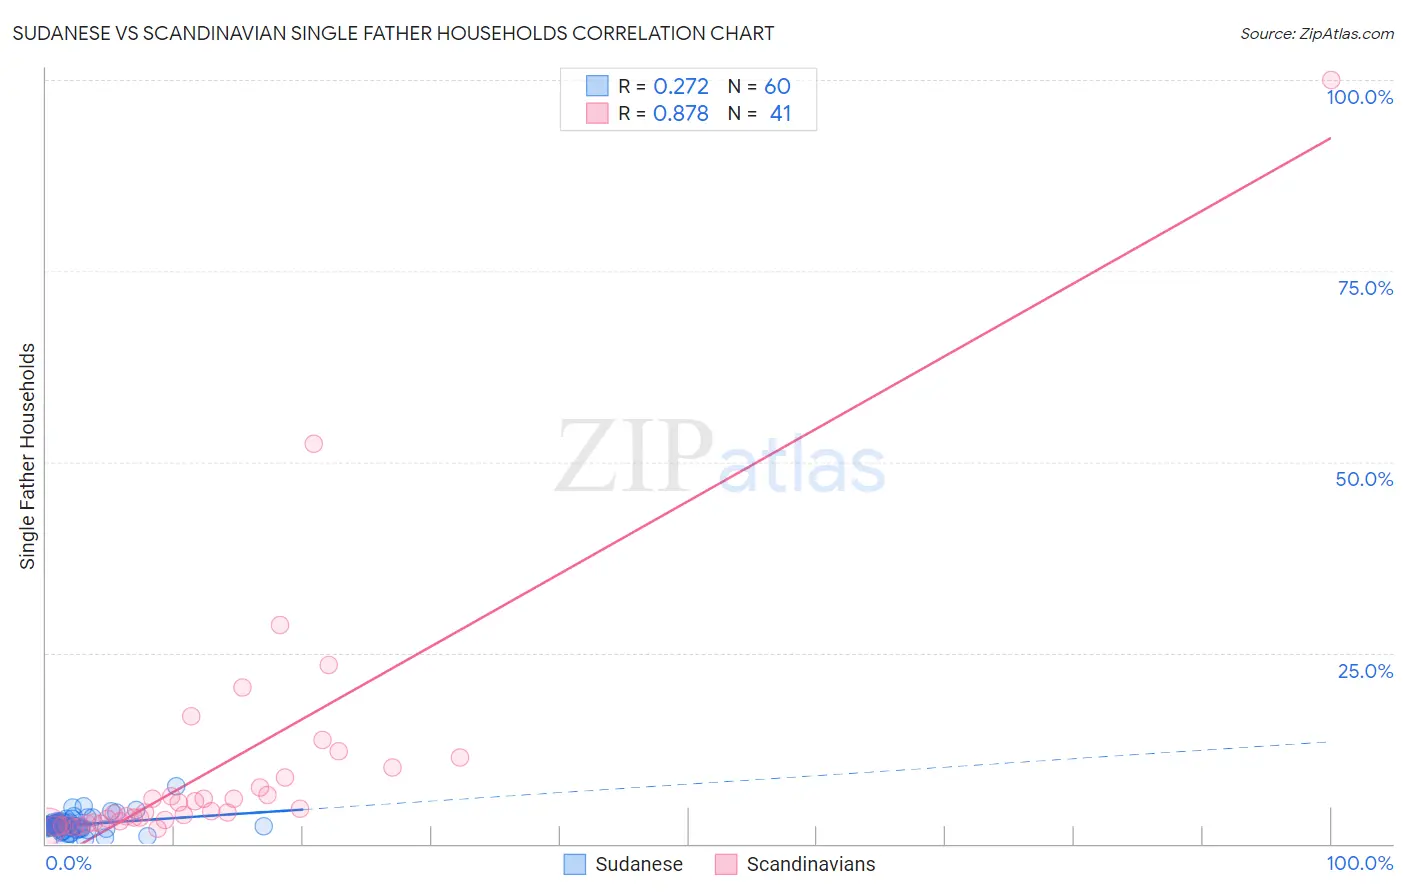
Sudanese vs Scandinavian Single Father Households Correlation Chart
The statistical analysis conducted on geographies consisting of 109,938,737 people shows a weak positive correlation between the proportion of Sudanese and percentage of single father households in the United States with a correlation coefficient (R) of 0.272 and weighted average of 2.4%. Similarly, the statistical analysis conducted on geographies consisting of 465,605,618 people shows a very strong positive correlation between the proportion of Scandinavians and percentage of single father households in the United States with a correlation coefficient (R) of 0.878 and weighted average of 2.4%, a difference of 1.7%.
Single Father Households Correlation Summary
| Measurement | Sudanese | Scandinavian |
| Minimum | 0.49% | 1.9% |
| Maximum | 7.5% | 100.0% |
| Range | 7.0% | 98.1% |
| Mean | 2.5% | 10.1% |
| Median | 2.4% | 4.3% |
| Interquartile 25% (IQ1) | 2.0% | 2.9% |
| Interquartile 75% (IQ3) | 2.8% | 9.3% |
| Interquartile Range (IQR) | 0.73% | 6.5% |
| Standard Deviation (Sample) | 1.1% | 17.2% |
| Standard Deviation (Population) | 1.1% | 16.9% |
Similar Demographics by Single Father Households
Demographics Similar to Sudanese by Single Father Households
In terms of single father households, the demographic groups most similar to Sudanese are Ghanaian (2.4%, a difference of 0.010%), Immigrants from Ethiopia (2.4%, a difference of 0.070%), Immigrants from Burma/Myanmar (2.4%, a difference of 0.14%), Immigrants from Eastern Africa (2.4%, a difference of 0.17%), and Dutch (2.4%, a difference of 0.20%).
| Demographics | Rating | Rank | Single Father Households |
| Finns | 18.3 /100 | #212 | Poor 2.4% |
| Norwegians | 17.1 /100 | #213 | Poor 2.4% |
| Ethiopians | 16.6 /100 | #214 | Poor 2.4% |
| Immigrants | South Eastern Asia | 15.9 /100 | #215 | Poor 2.4% |
| Immigrants | Ecuador | 14.9 /100 | #216 | Poor 2.4% |
| Dutch | 14.3 /100 | #217 | Poor 2.4% |
| Immigrants | Ethiopia | 13.4 /100 | #218 | Poor 2.4% |
| Sudanese | 13.0 /100 | #219 | Poor 2.4% |
| Ghanaians | 12.9 /100 | #220 | Poor 2.4% |
| Immigrants | Burma/Myanmar | 12.1 /100 | #221 | Poor 2.4% |
| Immigrants | Eastern Africa | 11.9 /100 | #222 | Poor 2.4% |
| Immigrants | Uruguay | 11.0 /100 | #223 | Poor 2.4% |
| Immigrants | Bahamas | 10.6 /100 | #224 | Poor 2.4% |
| Marshallese | 9.7 /100 | #225 | Tragic 2.4% |
| Blacks/African Americans | 9.7 /100 | #226 | Tragic 2.4% |
Demographics Similar to Scandinavians by Single Father Households
In terms of single father households, the demographic groups most similar to Scandinavians are Immigrants from Vietnam (2.4%, a difference of 0.030%), Peruvian (2.4%, a difference of 0.030%), German (2.4%, a difference of 0.050%), Kenyan (2.4%, a difference of 0.060%), and Immigrants from Philippines (2.4%, a difference of 0.11%).
| Demographics | Rating | Rank | Single Father Households |
| Immigrants | Africa | 30.0 /100 | #191 | Fair 2.4% |
| Immigrants | Sudan | 29.8 /100 | #192 | Fair 2.4% |
| Uruguayans | 29.7 /100 | #193 | Fair 2.4% |
| Panamanians | 29.6 /100 | #194 | Fair 2.4% |
| Immigrants | Philippines | 28.7 /100 | #195 | Fair 2.4% |
| Kenyans | 28.0 /100 | #196 | Fair 2.4% |
| Germans | 28.0 /100 | #197 | Fair 2.4% |
| Scandinavians | 27.4 /100 | #198 | Fair 2.4% |
| Immigrants | Vietnam | 27.1 /100 | #199 | Fair 2.4% |
| Peruvians | 27.1 /100 | #200 | Fair 2.4% |
| Immigrants | Uganda | 26.0 /100 | #201 | Fair 2.4% |
| German Russians | 25.7 /100 | #202 | Fair 2.4% |
| French Canadians | 24.7 /100 | #203 | Fair 2.4% |
| Ecuadorians | 24.5 /100 | #204 | Fair 2.4% |
| Immigrants | Afghanistan | 24.2 /100 | #205 | Fair 2.4% |