Sudanese vs Immigrants from Pakistan Self-Care Disability
COMPARE
Sudanese
Immigrants from Pakistan
Self-Care Disability
Self-Care Disability Comparison
Sudanese
Immigrants from Pakistan
2.2%
SELF-CARE DISABILITY
100.0/ 100
METRIC RATING
10th/ 347
METRIC RANK
2.3%
SELF-CARE DISABILITY
99.8/ 100
METRIC RATING
43rd/ 347
METRIC RANK
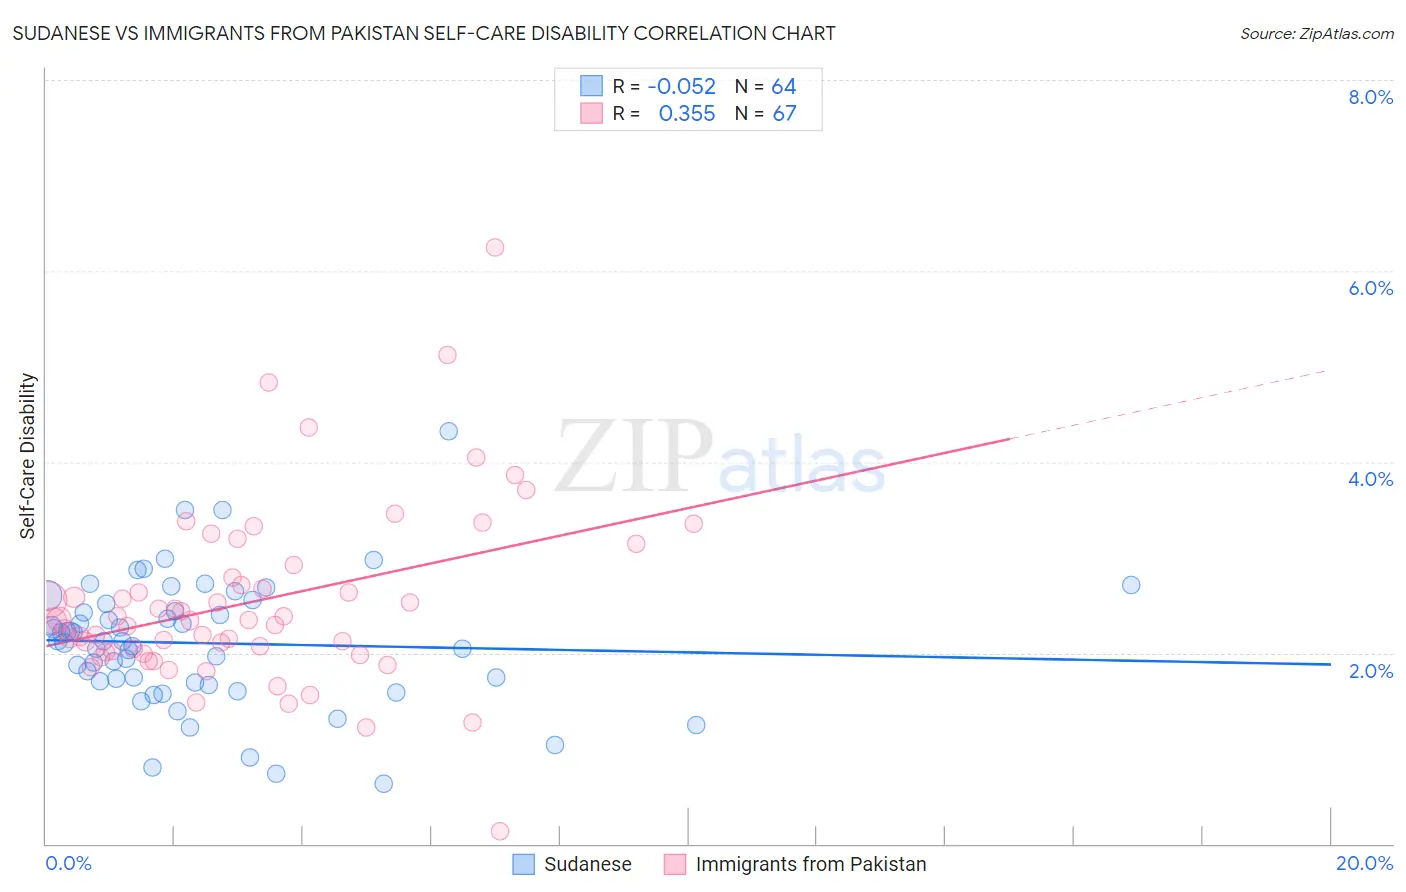
Sudanese vs Immigrants from Pakistan Self-Care Disability Correlation Chart
The statistical analysis conducted on geographies consisting of 110,094,977 people shows a slight negative correlation between the proportion of Sudanese and percentage of population with self-care disability in the United States with a correlation coefficient (R) of -0.052 and weighted average of 2.2%. Similarly, the statistical analysis conducted on geographies consisting of 283,675,484 people shows a mild positive correlation between the proportion of Immigrants from Pakistan and percentage of population with self-care disability in the United States with a correlation coefficient (R) of 0.355 and weighted average of 2.3%, a difference of 4.2%.
Self-Care Disability Correlation Summary
| Measurement | Sudanese | Immigrants from Pakistan |
| Minimum | 0.62% | 0.14% |
| Maximum | 4.3% | 6.2% |
| Range | 3.7% | 6.1% |
| Mean | 2.1% | 2.5% |
| Median | 2.1% | 2.3% |
| Interquartile 25% (IQ1) | 1.7% | 2.0% |
| Interquartile 75% (IQ3) | 2.5% | 2.8% |
| Interquartile Range (IQR) | 0.78% | 0.78% |
| Standard Deviation (Sample) | 0.67% | 0.95% |
| Standard Deviation (Population) | 0.67% | 0.94% |
Similar Demographics by Self-Care Disability
Demographics Similar to Sudanese by Self-Care Disability
In terms of self-care disability, the demographic groups most similar to Sudanese are Immigrants from South Central Asia (2.2%, a difference of 0.10%), Immigrants from Ethiopia (2.2%, a difference of 0.16%), Ethiopian (2.2%, a difference of 0.17%), Luxembourger (2.2%, a difference of 0.33%), and Okinawan (2.2%, a difference of 0.34%).
| Demographics | Rating | Rank | Self-Care Disability |
| Thais | 100.0 /100 | #3 | Exceptional 2.1% |
| Immigrants | Singapore | 100.0 /100 | #4 | Exceptional 2.1% |
| Zimbabweans | 100.0 /100 | #5 | Exceptional 2.2% |
| Filipinos | 100.0 /100 | #6 | Exceptional 2.2% |
| Immigrants | Bolivia | 100.0 /100 | #7 | Exceptional 2.2% |
| Bolivians | 100.0 /100 | #8 | Exceptional 2.2% |
| Immigrants | Nepal | 100.0 /100 | #9 | Exceptional 2.2% |
| Sudanese | 100.0 /100 | #10 | Exceptional 2.2% |
| Immigrants | South Central Asia | 100.0 /100 | #11 | Exceptional 2.2% |
| Immigrants | Ethiopia | 100.0 /100 | #12 | Exceptional 2.2% |
| Ethiopians | 100.0 /100 | #13 | Exceptional 2.2% |
| Luxembourgers | 100.0 /100 | #14 | Exceptional 2.2% |
| Okinawans | 100.0 /100 | #15 | Exceptional 2.2% |
| Immigrants | Kuwait | 100.0 /100 | #16 | Exceptional 2.2% |
| Immigrants | Saudi Arabia | 100.0 /100 | #17 | Exceptional 2.2% |
Demographics Similar to Immigrants from Pakistan by Self-Care Disability
In terms of self-care disability, the demographic groups most similar to Immigrants from Pakistan are Immigrants from South Africa (2.3%, a difference of 0.040%), Immigrants from Uganda (2.3%, a difference of 0.050%), Norwegian (2.3%, a difference of 0.090%), Immigrants from Sudan (2.3%, a difference of 0.14%), and Czech (2.3%, a difference of 0.17%).
| Demographics | Rating | Rank | Self-Care Disability |
| Immigrants | Lithuania | 99.9 /100 | #36 | Exceptional 2.3% |
| Immigrants | Sweden | 99.9 /100 | #37 | Exceptional 2.3% |
| Immigrants | Eastern Africa | 99.9 /100 | #38 | Exceptional 2.3% |
| Immigrants | Bulgaria | 99.8 /100 | #39 | Exceptional 2.3% |
| Iranians | 99.8 /100 | #40 | Exceptional 2.3% |
| Immigrants | Sudan | 99.8 /100 | #41 | Exceptional 2.3% |
| Immigrants | Uganda | 99.8 /100 | #42 | Exceptional 2.3% |
| Immigrants | Pakistan | 99.8 /100 | #43 | Exceptional 2.3% |
| Immigrants | South Africa | 99.8 /100 | #44 | Exceptional 2.3% |
| Norwegians | 99.8 /100 | #45 | Exceptional 2.3% |
| Czechs | 99.8 /100 | #46 | Exceptional 2.3% |
| Jordanians | 99.7 /100 | #47 | Exceptional 2.3% |
| Immigrants | Malaysia | 99.7 /100 | #48 | Exceptional 2.3% |
| Latvians | 99.7 /100 | #49 | Exceptional 2.3% |
| Immigrants | Brazil | 99.7 /100 | #50 | Exceptional 2.3% |