Immigrants from South America vs Scandinavian Self-Care Disability
COMPARE
Immigrants from South America
Scandinavian
Self-Care Disability
Self-Care Disability Comparison
Immigrants from South America
Scandinavians
2.4%
SELF-CARE DISABILITY
88.8/ 100
METRIC RATING
132nd/ 347
METRIC RANK
2.4%
SELF-CARE DISABILITY
93.5/ 100
METRIC RATING
112th/ 347
METRIC RANK
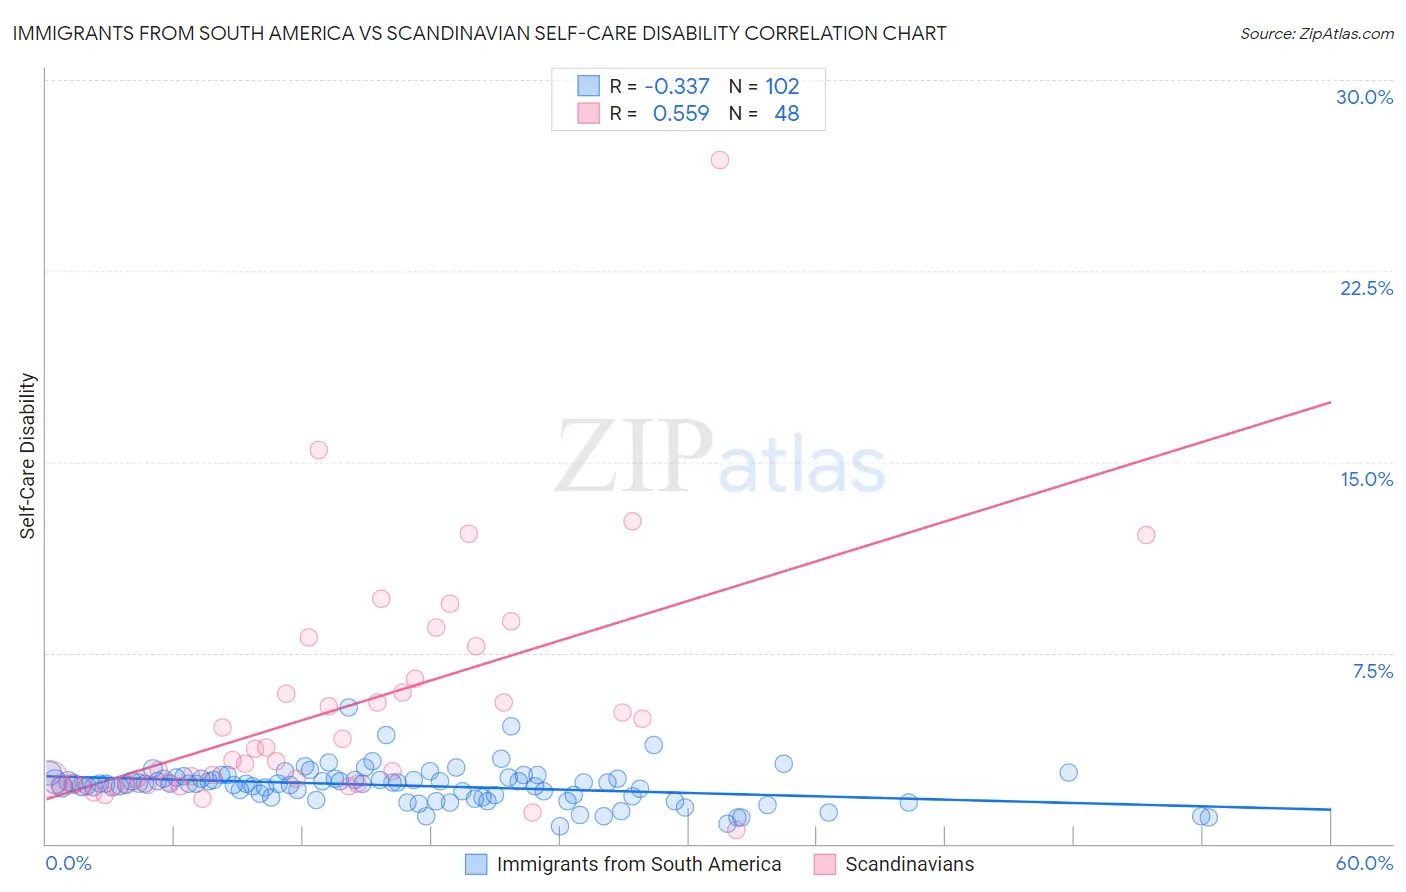
Immigrants from South America vs Scandinavian Self-Care Disability Correlation Chart
The statistical analysis conducted on geographies consisting of 485,509,375 people shows a mild negative correlation between the proportion of Immigrants from South America and percentage of population with self-care disability in the United States with a correlation coefficient (R) of -0.337 and weighted average of 2.4%. Similarly, the statistical analysis conducted on geographies consisting of 471,531,720 people shows a substantial positive correlation between the proportion of Scandinavians and percentage of population with self-care disability in the United States with a correlation coefficient (R) of 0.559 and weighted average of 2.4%, a difference of 0.73%.
Self-Care Disability Correlation Summary
| Measurement | Immigrants from South America | Scandinavian |
| Minimum | 0.67% | 0.56% |
| Maximum | 5.3% | 26.9% |
| Range | 4.7% | 26.3% |
| Mean | 2.3% | 5.2% |
| Median | 2.4% | 3.3% |
| Interquartile 25% (IQ1) | 1.8% | 2.4% |
| Interquartile 75% (IQ3) | 2.5% | 6.2% |
| Interquartile Range (IQR) | 0.70% | 3.9% |
| Standard Deviation (Sample) | 0.73% | 4.7% |
| Standard Deviation (Population) | 0.73% | 4.6% |
Demographics Similar to Immigrants from South America and Scandinavians by Self-Care Disability
In terms of self-care disability, the demographic groups most similar to Immigrants from South America are Polish (2.4%, a difference of 0.010%), Immigrants from Austria (2.4%, a difference of 0.030%), Immigrants from Romania (2.4%, a difference of 0.050%), Immigrants from Hungary (2.4%, a difference of 0.10%), and Colombian (2.4%, a difference of 0.11%). Similarly, the demographic groups most similar to Scandinavians are South American (2.4%, a difference of 0.060%), Immigrants from North Macedonia (2.4%, a difference of 0.070%), Immigrants from Hong Kong (2.4%, a difference of 0.070%), Northern European (2.4%, a difference of 0.12%), and Taiwanese (2.4%, a difference of 0.19%).
| Demographics | Rating | Rank | Self-Care Disability |
| Scandinavians | 93.5 /100 | #112 | Exceptional 2.4% |
| South Americans | 93.2 /100 | #113 | Exceptional 2.4% |
| Immigrants | North Macedonia | 93.1 /100 | #114 | Exceptional 2.4% |
| Immigrants | Hong Kong | 93.1 /100 | #115 | Exceptional 2.4% |
| Northern Europeans | 92.9 /100 | #116 | Exceptional 2.4% |
| Taiwanese | 92.5 /100 | #117 | Exceptional 2.4% |
| Immigrants | Canada | 92.0 /100 | #118 | Exceptional 2.4% |
| Immigrants | Sierra Leone | 91.8 /100 | #119 | Exceptional 2.4% |
| Uruguayans | 91.5 /100 | #120 | Exceptional 2.4% |
| Peruvians | 91.3 /100 | #121 | Exceptional 2.4% |
| Belgians | 90.9 /100 | #122 | Exceptional 2.4% |
| Immigrants | Nigeria | 90.3 /100 | #123 | Exceptional 2.4% |
| Immigrants | North America | 90.2 /100 | #124 | Exceptional 2.4% |
| Immigrants | Morocco | 90.2 /100 | #124 | Exceptional 2.4% |
| Hmong | 89.9 /100 | #126 | Excellent 2.4% |
| Colombians | 89.7 /100 | #127 | Excellent 2.4% |
| Immigrants | Hungary | 89.6 /100 | #128 | Excellent 2.4% |
| Immigrants | Romania | 89.3 /100 | #129 | Excellent 2.4% |
| Immigrants | Austria | 89.0 /100 | #130 | Excellent 2.4% |
| Poles | 88.9 /100 | #131 | Excellent 2.4% |
| Immigrants | South America | 88.8 /100 | #132 | Excellent 2.4% |