Sudanese vs Ottawa Self-Care Disability
COMPARE
Sudanese
Ottawa
Self-Care Disability
Self-Care Disability Comparison
Sudanese
Ottawa
2.2%
SELF-CARE DISABILITY
100.0/ 100
METRIC RATING
10th/ 347
METRIC RANK
2.7%
SELF-CARE DISABILITY
0.1/ 100
METRIC RATING
278th/ 347
METRIC RANK
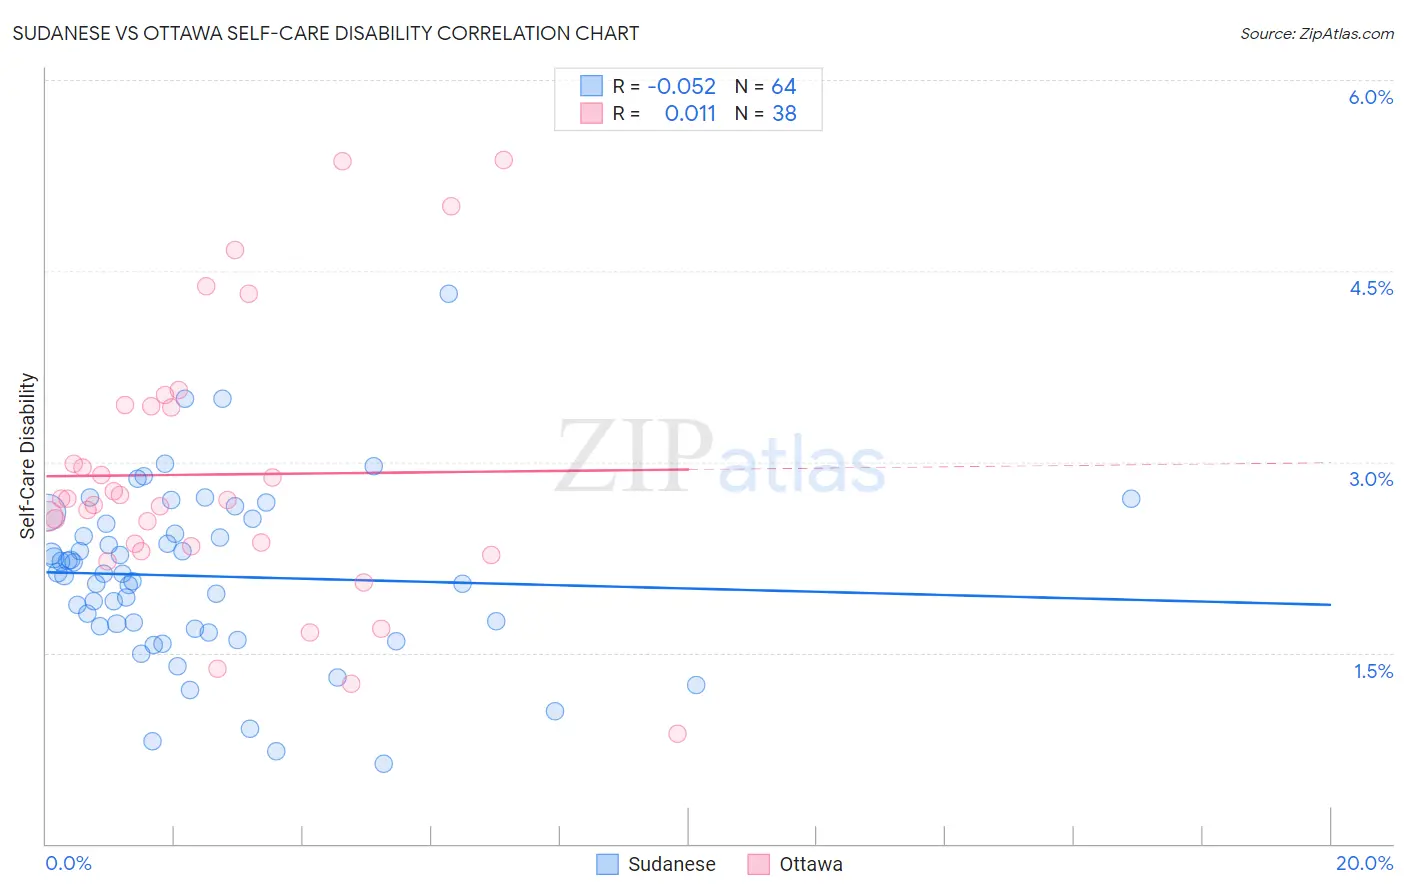
Sudanese vs Ottawa Self-Care Disability Correlation Chart
The statistical analysis conducted on geographies consisting of 110,094,977 people shows a slight negative correlation between the proportion of Sudanese and percentage of population with self-care disability in the United States with a correlation coefficient (R) of -0.052 and weighted average of 2.2%. Similarly, the statistical analysis conducted on geographies consisting of 49,939,429 people shows no correlation between the proportion of Ottawa and percentage of population with self-care disability in the United States with a correlation coefficient (R) of 0.011 and weighted average of 2.7%, a difference of 22.6%.
Self-Care Disability Correlation Summary
| Measurement | Sudanese | Ottawa |
| Minimum | 0.62% | 0.86% |
| Maximum | 4.3% | 5.4% |
| Range | 3.7% | 4.5% |
| Mean | 2.1% | 2.9% |
| Median | 2.1% | 2.7% |
| Interquartile 25% (IQ1) | 1.7% | 2.3% |
| Interquartile 75% (IQ3) | 2.5% | 3.4% |
| Interquartile Range (IQR) | 0.78% | 1.1% |
| Standard Deviation (Sample) | 0.67% | 1.1% |
| Standard Deviation (Population) | 0.67% | 1.0% |
Similar Demographics by Self-Care Disability
Demographics Similar to Sudanese by Self-Care Disability
In terms of self-care disability, the demographic groups most similar to Sudanese are Immigrants from South Central Asia (2.2%, a difference of 0.10%), Immigrants from Ethiopia (2.2%, a difference of 0.16%), Ethiopian (2.2%, a difference of 0.17%), Luxembourger (2.2%, a difference of 0.33%), and Okinawan (2.2%, a difference of 0.34%).
| Demographics | Rating | Rank | Self-Care Disability |
| Thais | 100.0 /100 | #3 | Exceptional 2.1% |
| Immigrants | Singapore | 100.0 /100 | #4 | Exceptional 2.1% |
| Zimbabweans | 100.0 /100 | #5 | Exceptional 2.2% |
| Filipinos | 100.0 /100 | #6 | Exceptional 2.2% |
| Immigrants | Bolivia | 100.0 /100 | #7 | Exceptional 2.2% |
| Bolivians | 100.0 /100 | #8 | Exceptional 2.2% |
| Immigrants | Nepal | 100.0 /100 | #9 | Exceptional 2.2% |
| Sudanese | 100.0 /100 | #10 | Exceptional 2.2% |
| Immigrants | South Central Asia | 100.0 /100 | #11 | Exceptional 2.2% |
| Immigrants | Ethiopia | 100.0 /100 | #12 | Exceptional 2.2% |
| Ethiopians | 100.0 /100 | #13 | Exceptional 2.2% |
| Luxembourgers | 100.0 /100 | #14 | Exceptional 2.2% |
| Okinawans | 100.0 /100 | #15 | Exceptional 2.2% |
| Immigrants | Kuwait | 100.0 /100 | #16 | Exceptional 2.2% |
| Immigrants | Saudi Arabia | 100.0 /100 | #17 | Exceptional 2.2% |
Demographics Similar to Ottawa by Self-Care Disability
In terms of self-care disability, the demographic groups most similar to Ottawa are Immigrants from Ukraine (2.7%, a difference of 0.080%), Iroquois (2.7%, a difference of 0.10%), Hispanic or Latino (2.7%, a difference of 0.12%), Japanese (2.7%, a difference of 0.14%), and Yakama (2.7%, a difference of 0.27%).
| Demographics | Rating | Rank | Self-Care Disability |
| Trinidadians and Tobagonians | 0.1 /100 | #271 | Tragic 2.7% |
| Immigrants | Laos | 0.1 /100 | #272 | Tragic 2.7% |
| Mexicans | 0.1 /100 | #273 | Tragic 2.7% |
| Yakama | 0.1 /100 | #274 | Tragic 2.7% |
| Immigrants | Trinidad and Tobago | 0.1 /100 | #275 | Tragic 2.7% |
| Japanese | 0.1 /100 | #276 | Tragic 2.7% |
| Immigrants | Ukraine | 0.1 /100 | #277 | Tragic 2.7% |
| Ottawa | 0.1 /100 | #278 | Tragic 2.7% |
| Iroquois | 0.1 /100 | #279 | Tragic 2.7% |
| Hispanics or Latinos | 0.1 /100 | #280 | Tragic 2.7% |
| Immigrants | Iraq | 0.0 /100 | #281 | Tragic 2.7% |
| Apache | 0.0 /100 | #282 | Tragic 2.7% |
| Delaware | 0.0 /100 | #283 | Tragic 2.7% |
| Fijians | 0.0 /100 | #284 | Tragic 2.7% |
| Jamaicans | 0.0 /100 | #285 | Tragic 2.7% |