Subsaharan African vs Cree Disability Age 18 to 34
COMPARE
Subsaharan African
Cree
Disability Age 18 to 34
Disability Age 18 to 34 Comparison
Sub-Saharan Africans
Cree
7.1%
DISABILITY AGE 18 TO 34
1.7/ 100
METRIC RATING
235th/ 347
METRIC RANK
8.1%
DISABILITY AGE 18 TO 34
0.0/ 100
METRIC RATING
322nd/ 347
METRIC RANK
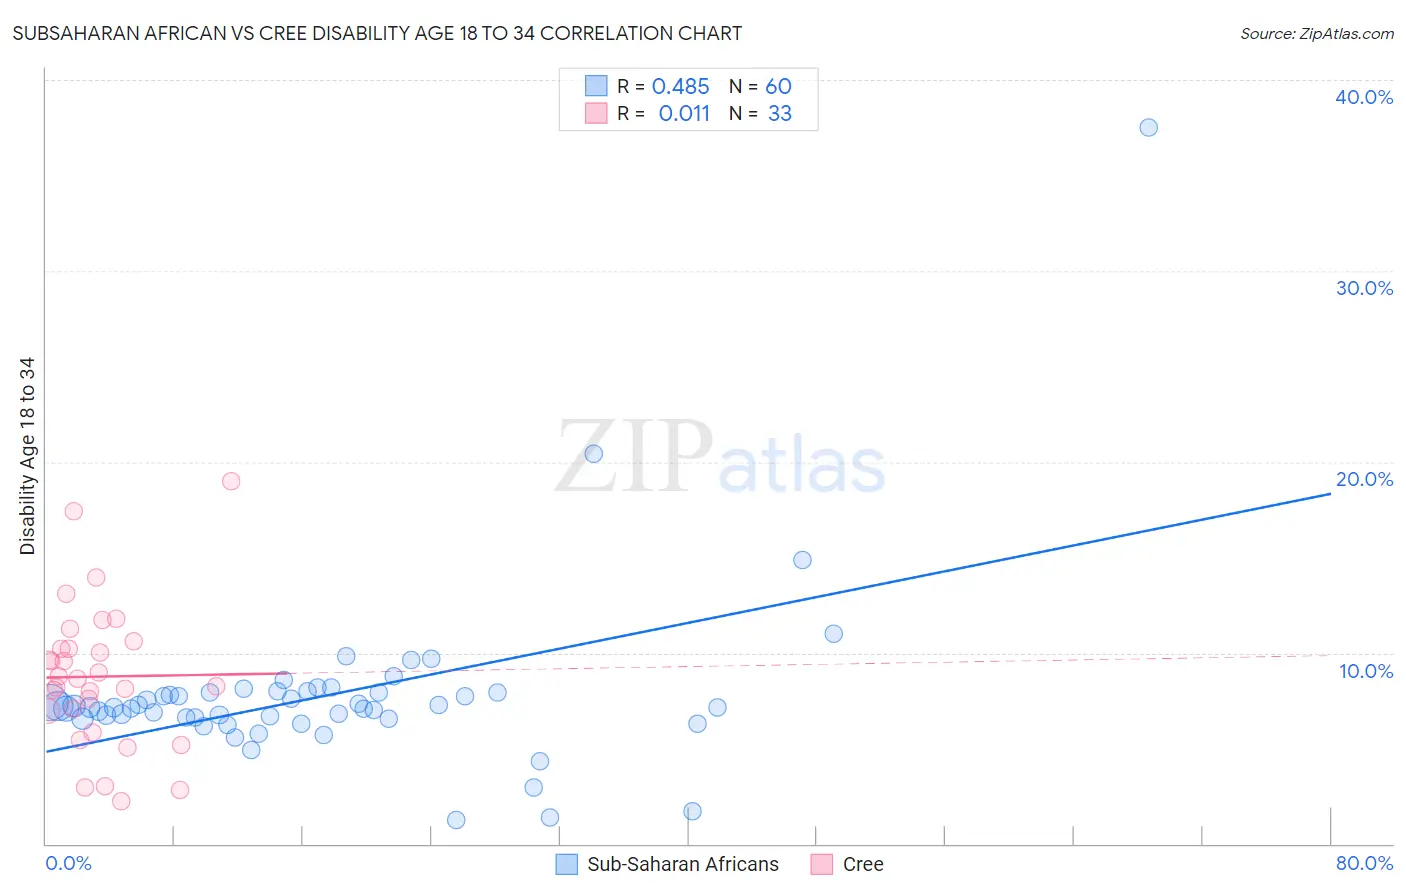
Subsaharan African vs Cree Disability Age 18 to 34 Correlation Chart
The statistical analysis conducted on geographies consisting of 506,334,183 people shows a moderate positive correlation between the proportion of Sub-Saharan Africans and percentage of population with a disability between the ages 18 and 35 in the United States with a correlation coefficient (R) of 0.485 and weighted average of 7.1%. Similarly, the statistical analysis conducted on geographies consisting of 76,144,663 people shows no correlation between the proportion of Cree and percentage of population with a disability between the ages 18 and 35 in the United States with a correlation coefficient (R) of 0.011 and weighted average of 8.1%, a difference of 15.1%.
Disability Age 18 to 34 Correlation Summary
| Measurement | Subsaharan African | Cree |
| Minimum | 1.2% | 2.2% |
| Maximum | 37.5% | 19.0% |
| Range | 36.3% | 16.8% |
| Mean | 7.8% | 8.8% |
| Median | 7.1% | 8.6% |
| Interquartile 25% (IQ1) | 6.6% | 6.4% |
| Interquartile 75% (IQ3) | 7.9% | 10.4% |
| Interquartile Range (IQR) | 1.4% | 4.0% |
| Standard Deviation (Sample) | 4.7% | 3.8% |
| Standard Deviation (Population) | 4.7% | 3.7% |
Similar Demographics by Disability Age 18 to 34
Demographics Similar to Sub-Saharan Africans by Disability Age 18 to 34
In terms of disability age 18 to 34, the demographic groups most similar to Sub-Saharan Africans are Liberian (7.1%, a difference of 0.25%), Alsatian (7.0%, a difference of 0.37%), Austrian (7.1%, a difference of 0.42%), Marshallese (7.1%, a difference of 0.47%), and Italian (7.1%, a difference of 0.58%).
| Demographics | Rating | Rank | Disability Age 18 to 34 |
| Immigrants | Yemen | 4.2 /100 | #228 | Tragic 7.0% |
| Lithuanians | 4.1 /100 | #229 | Tragic 7.0% |
| Immigrants | North America | 3.9 /100 | #230 | Tragic 7.0% |
| Ute | 3.8 /100 | #231 | Tragic 7.0% |
| Samoans | 3.2 /100 | #232 | Tragic 7.0% |
| New Zealanders | 2.7 /100 | #233 | Tragic 7.0% |
| Alsatians | 2.1 /100 | #234 | Tragic 7.0% |
| Sub-Saharan Africans | 1.7 /100 | #235 | Tragic 7.1% |
| Liberians | 1.5 /100 | #236 | Tragic 7.1% |
| Austrians | 1.3 /100 | #237 | Tragic 7.1% |
| Marshallese | 1.3 /100 | #238 | Tragic 7.1% |
| Italians | 1.2 /100 | #239 | Tragic 7.1% |
| Arapaho | 1.1 /100 | #240 | Tragic 7.1% |
| Nepalese | 1.1 /100 | #241 | Tragic 7.1% |
| Immigrants | Congo | 1.1 /100 | #242 | Tragic 7.1% |
Demographics Similar to Cree by Disability Age 18 to 34
In terms of disability age 18 to 34, the demographic groups most similar to Cree are Blackfeet (8.1%, a difference of 0.060%), Navajo (8.1%, a difference of 0.42%), Aleut (8.1%, a difference of 0.46%), French Canadian (8.1%, a difference of 0.51%), and French American Indian (8.2%, a difference of 0.51%).
| Demographics | Rating | Rank | Disability Age 18 to 34 |
| Americans | 0.0 /100 | #315 | Tragic 8.0% |
| Puerto Ricans | 0.0 /100 | #316 | Tragic 8.0% |
| Hmong | 0.0 /100 | #317 | Tragic 8.1% |
| French Canadians | 0.0 /100 | #318 | Tragic 8.1% |
| Aleuts | 0.0 /100 | #319 | Tragic 8.1% |
| Navajo | 0.0 /100 | #320 | Tragic 8.1% |
| Blackfeet | 0.0 /100 | #321 | Tragic 8.1% |
| Cree | 0.0 /100 | #322 | Tragic 8.1% |
| French American Indians | 0.0 /100 | #323 | Tragic 8.2% |
| Cajuns | 0.0 /100 | #324 | Tragic 8.2% |
| Natives/Alaskans | 0.0 /100 | #325 | Tragic 8.2% |
| Potawatomi | 0.0 /100 | #326 | Tragic 8.2% |
| Sioux | 0.0 /100 | #327 | Tragic 8.2% |
| Delaware | 0.0 /100 | #328 | Tragic 8.2% |
| Crow | 0.0 /100 | #329 | Tragic 8.3% |